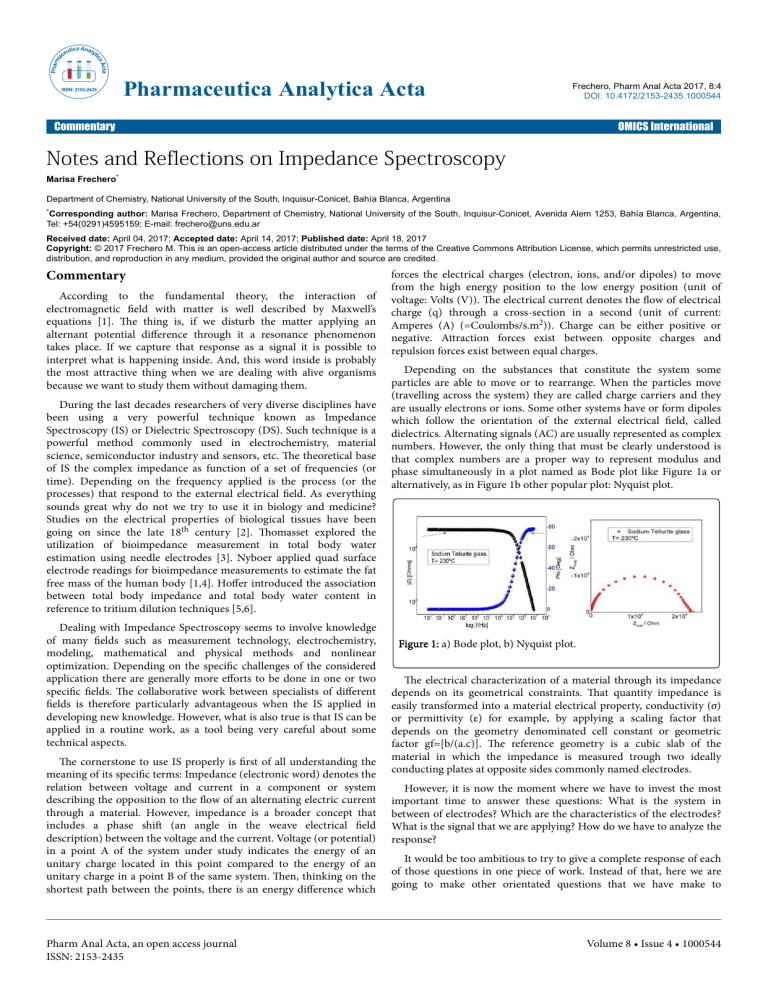
Pharmaceutica Analytica Acta Frechero, Pharm Anal Acta 2017, 8:4 DOI: 10.4172/2153-2435.1000544 Commentary OMICS International Notes and Reflections on Impedance Spectroscopy Marisa Frechero* Department of Chemistry, National University of the South, Inquisur-Conicet, Bahía Blanca, Argentina *Corresponding author: Marisa Frechero, Department of Chemistry, National University of the South, Inquisur-Conicet, Avenida Alem 1253, Bahía Blanca, Argentina, Tel: +54(0291)4595159; E-mail: frechero@uns.edu.ar Received date: April 04, 2017; Accepted date: April 14, 2017; Published date: April 18, 2017 Copyright: © 2017 Frechero M. This is an open-access article distributed under the terms of the Creative Commons Attribution License, which permits unrestricted use, distribution, and reproduction in any medium, provided the original author and source are credited. Commentary According to the fundamental theory, the interaction of electromagnetic field with matter is well described by Maxwell’s equations [1]. The thing is, if we disturb the matter applying an alternant potential difference through it a resonance phenomenon takes place. If we capture that response as a signal it is possible to interpret what is happening inside. And, this word inside is probably the most attractive thing when we are dealing with alive organisms because we want to study them without damaging them. During the last decades researchers of very diverse disciplines have been using a very powerful technique known as Impedance Spectroscopy (IS) or Dielectric Spectroscopy (DS). Such technique is a powerful method commonly used in electrochemistry, material science, semiconductor industry and sensors, etc. The theoretical base of IS the complex impedance as function of a set of frequencies (or time). Depending on the frequency applied is the process (or the processes) that respond to the external electrical field. As everything sounds great why do not we try to use it in biology and medicine? Studies on the electrical properties of biological tissues have been going on since the late 18th century [2]. Thomasset explored the utilization of bioimpedance measurement in total body water estimation using needle electrodes [3]. Nyboer applied quad surface electrode readings for bioimpedance measurements to estimate the fat free mass of the human body [1,4]. Hoffer introduced the association between total body impedance and total body water content in reference to tritium dilution techniques [5,6]. Dealing with Impedance Spectroscopy seems to involve knowledge of many fields such as measurement technology, electrochemistry, modeling, mathematical and physical methods and nonlinear optimization. Depending on the specific challenges of the considered application there are generally more efforts to be done in one or two specific fields. The collaborative work between specialists of different fields is therefore particularly advantageous when the IS applied in developing new knowledge. However, what is also true is that IS can be applied in a routine work, as a tool being very careful about some technical aspects. The cornerstone to use IS properly is first of all understanding the meaning of its specific terms: Impedance (electronic word) denotes the relation between voltage and current in a component or system describing the opposition to the flow of an alternating electric current through a material. However, impedance is a broader concept that includes a phase shift (an angle in the weave electrical field description) between the voltage and the current. Voltage (or potential) in a point A of the system under study indicates the energy of an unitary charge located in this point compared to the energy of an unitary charge in a point B of the same system. Then, thinking on the shortest path between the points, there is an energy difference which Pharm Anal Acta, an open access journal ISSN: 2153-2435 forces the electrical charges (electron, ions, and/or dipoles) to move from the high energy position to the low energy position (unit of voltage: Volts (V)). The electrical current denotes the flow of electrical charge (q) through a cross-section in a second (unit of current: Amperes (A) (=Coulombs/s.m2)). Charge can be either positive or negative. Attraction forces exist between opposite charges and repulsion forces exist between equal charges. Depending on the substances that constitute the system some particles are able to move or to rearrange. When the particles move (travelling across the system) they are called charge carriers and they are usually electrons or ions. Some other systems have or form dipoles which follow the orientation of the external electrical field, called dielectrics. Alternating signals (AC) are usually represented as complex numbers. However, the only thing that must be clearly understood is that complex numbers are a proper way to represent modulus and phase simultaneously in a plot named as Bode plot like Figure 1a or alternatively, as in Figure 1b other popular plot: Nyquist plot. Figure 1: a) Bode plot, b) Nyquist plot. The electrical characterization of a material through its impedance depends on its geometrical constraints. That quantity impedance is easily transformed into a material electrical property, conductivity (σ) or permittivity (ε) for example, by applying a scaling factor that depends on the geometry denominated cell constant or geometric factor gf=[b/(a.c)]. The reference geometry is a cubic slab of the material in which the impedance is measured trough two ideally conducting plates at opposite sides commonly named electrodes. However, it is now the moment where we have to invest the most important time to answer these questions: What is the system in between of electrodes? Which are the characteristics of the electrodes? What is the signal that we are applying? How do we have to analyze the response? It would be too ambitious to try to give a complete response of each of those questions in one piece of work. Instead of that, here we are going to make other orientated questions that we have make to Volume 8 • Issue 4 • 1000544 Citation: Frechero M (2017) Notes and Reflections on Impedance Spectroscopy. Pharm Anal Acta 8: 543. doi:10.4172/2153-2435.1000544 Page 2 of 4 ourselves previously to use this technique and also some useful bibliography. Impedance analysis is based on the Linear Response Theory (LRT) and fluctuation dissipation theorem [7,8]. When certain condition such as sufficiently small excitation amplitude is applied it is possible to ensure the quasi-linearity behaviour [9,10]. This is a topic to solve because it depends strongly on the system under study. But, what is a small signal? Figure 2: Cell constant or geometric factor gf=[b/(a.c)]. easy to use, it is not destructive, it is possible to apply on live systems (without hurt), it is not quite expensive and it is portable and some other wonderful characteristics. Figure 3: Electrical measurements of a tellurite glass where the main charge carriers are polarons and the conduction process is by polaron hopping mechanism. Now, some new questions come: Is the system under study homogenous or heterogeneous (but, if is heterogeneous in what proportion/fraction)? Is the system isotropic or not, continuous or granular? Is it solid? Does it have an ordered structure or not? Are their components organic, inorganic or mixed? Are their components natural or synthetic? Is it a live organism? Does the system have a hydrophilic or hydrophobic behavior? Is it sensitive to the oxygen pressure? Can it react with the electrodes or other component inside of it? The thing is, as deepest the knowledge of the material is, the better comprehension of the response. A clearest understanding of the systems allows us to determine which electrical formalism we will applied to analyze the data [9]. One of the most popular methods to analyze the IS response is the use of equivalent circuits, i.e., analyze the electrical response as it was provided by a set of traditional electrical elements like resistors, capacitors and inductors combined in different ways (circuits). However, the use of this procedure requires a previous identification (correlation) between which parts or components of the system that we are studying could act as a resistor, a capacitor or an inductor and how they are related in order to assume some electrical equivalent circuit. Many times such simplification (model chosen) is not so easy. Additionally, the range of frequency that we are studying has to be selected according to the response that we expect. Then, we see if it is possible to applied equivalent electrical circuits or if we need a different mathematical formalism for our data analysis. In the following we present some experimental results of a set of very dissimilar materials in order to illustrate the above mentioned questions. In the following some examples are presented in order to illustrate that the Impedance spectroscopy is a very powerful technique if we are able to answer most of the question presented before. On the contrary, it is not possible to understand the response; this is not an absolute technique. However, it has many important advantages: it is fast, it is Pharm Anal Acta, an open access journal ISSN: 2153-2435 Figure 4: Electrical measurements of a phosphate glass where the main charge carriers are lithium cations and the conduction process is by ion hopping mechanism. Others ionic conductors like Yttrium-circonia modified (YSZ) single crystal (that is an oxygen conductor at high temperature applied in SOFCs) in which the conduction process involved is by ion hopping mechanism, gives a similar response. However, when two single crystals are connected through a boundary we are able to detect the presence of such perturbation on the diffusion of the charge carrier, see [11]. Such response of the crystal border is many times multiplied when a material is former by grains like in a ceramic material or polycrystalline material [12,13]. Volume 8 • Issue 4 • 1000544 Citation: Frechero M (2017) Notes and Reflections on Impedance Spectroscopy. Pharm Anal Acta 8: 543. doi:10.4172/2153-2435.1000544 Page 3 of 4 When a system is a pure substance like AgI which behaves as a pure ionic conductor, we see a response like: Figure 5: Real conductivity of AgI salt where the main charge carriers are silver ions. When the system is heterogeneous, as for example a composite made of a matrix of sodium silicate glass which contains in its sine silver nanoparticles (in a low proportion, less than 5 wt%), we have a complex system. This system is composed by two very different materials, one phase is a highly dielectric matrix (the glass) and the second phase is formed by metal spheres which are electrical conductors. Figure 7: Electrical measurements of a haricot bean, a very complex live system where the conduction process is the result of a set of phases, borders of phases and mechanisms. Finally, we can say that the impedance spectroscopy is a powerful technique: *In agriculture: For solving problems associated with production, handling, and processing of agricultural products; to work on controlling stored-grain insects; to improve seed germination and seedling performance; grain and seed moisture sensing applications. The dielectric properties are the most widely used in practical agricultural [14]. *In food science: To non-chemical disinfestations of food; for many novel sanitation and preservation purposes; non-food and agricultural commodities and to study the hydration mechanisms in seeds [15,16]. *In human diseases treatments: For the early detection of breast cancer in young women [17]. *In medicine: To characterize biologic tissues, to estimate blood alcohol content, etc. [18,19]. *In the study of inorganic/organic materials: To analyze diffusion and ionic conduction in nanocrystallines [20]. *And many other systems. References Figure 6: Electrical measurements of a composite of sodium silicate glass with silver nanoparticles inside. Therefore, our main question is: How can this technique be useful? And the answer is: this is a very powerful technique if we understand our system previously and we assume the proper model to analyze its response to the perturbation. We can never use the impedance spectroscopy response as a technique to study a system solely through it (Figures 2-7). 1. 2. 3. 4. 5. 6. Pharm Anal Acta, an open access journal ISSN: 2153-2435 Maxwell JC (1865) A Dynamical Theory of the Electromagnetic Field. Phil Trans R Soc Lond 155: 459-512. Kyle UG, Bosaeus I, De Lorenzo AD, Deurenberg P, Elia M, et al. (2004) Bioelectrical impedance analysis-part II: utilization in clinical practice. M Pirlich Clin Nutr 23: 1430-1453. Thomasset A (1962) Bioelectrical properties of tissue impedance. Lyon Med 207: 107-118. Nyboer J (1971) Electrical Impedance Plethysmography. Springfield, Illinois (2nd edn.). Chest 59: 722. Hoffer EC, Meador CK, Simpson DC (1969) Correlation of whole-body impedance with total body water volume. J Appl Physiol 27: 531-534. Khalil SF, Mohktar MS, Fatimah I (2014) The Theory and Fundamentals of Bioimpedance Analysis in Clinical Status Monitoring and Diagnosis of Diseases. Sensors 14: 10895-10928. Volume 8 • Issue 4 • 1000544 Citation: Frechero M (2017) Notes and Reflections on Impedance Spectroscopy. Pharm Anal Acta 8: 543. doi:10.4172/2153-2435.1000544 Page 4 of 4 7. 8. 9. 10. 11. 12. 13. Kubo R (1957) Statistical-Mechanical Theory of Irreversible Processes. I. General Theory and Simple Applications to Magnetic and Conduction Problems. J Phys Soc Jpn 12: 570-586. Kubo R (1966) The fluctuation-dissipation theorem. Rep Prog Phys 29: 255-284. Kremer F, Schonhals A (2003) Broadband Dielectric Spectroscopy. Springer, Verlag, Berlin. Barsoukov E, Macdonald JR (2005) Impedance spectroscopy, theory, experiment and applications (2nd edn.). John Wiley & Sons, Inc. Frechero MA, Rocci M, Sanchez-Santolino G, Kumar A, Salafranca J, et al. (2015) Paving the way to nanoionics: atomic origin of barriers for ionic transport through interfaces. Sci Rep 5: 17229. Díaz-Guillén MR, Frechero MA, Díaz-Guillen JA, Fuentes AF, Leon C (2015) Nearly constant loss in crystalline oxide-ion conductor Gd2 Zr2 O 7. J Electro 34: 15-19. Frechero MA, Dura OJ, Díaz-Guillen MR, Moreno KJ, Díaz-Guillén JA, et al. (2015) Oxygen ion dynamics in pyrochlore-type ionic conductors: Effects of structure and ion–ion cooperativity. J Non Cryst Solids 407: 349-354. Pharm Anal Acta, an open access journal ISSN: 2153-2435 14. 15. 16. 17. 18. 19. 20. Nelson S (2015) Dielectric Properties of Agricultural Materials and Their Applications. Elsevier Inc., USA. Manuel C, Solar L (2012) Non-Chemical Disinfestation of Food and Agricultural Commodities with Radiofrequency Power. Insecticides-Basic and Other Applications, Agricultural and Biological Sciences. Konsta AA, Pissis P, Kanapitsas A, Ratkovi S (1996) Dielectric and conductivity studies of the hydration mechanisms in plant seeds. Biophys J 70: 1485-1493. Stojadinovic A, Nissan A, Gallimidi Z, Lenington S, Logan W, et al. (2005) Electrical Impedance Scanning for the Early Detection of Breast Cancer in Young Women: Preliminary Results of a Multicenter Prospective Clinical Trial. J Clin Oncol 23: 2703-2715. Scwan HP (1995) IX International conference on Electrical BioImpedance. ICPRBI, Heidelberg, Germany. Mark U, Michael C, Antje P, Matthias Z, Steffen L (2013) Lecture Notes on Impedance Spectroscopy. CRC Press 5: 27-35. Heitjans P, Indris S (2001) Diffusion and Ionic Conduction in Nanocrystalline Ceramics MRS Online Proceedings 676. Volume 8 • Issue 4 • 1000544


