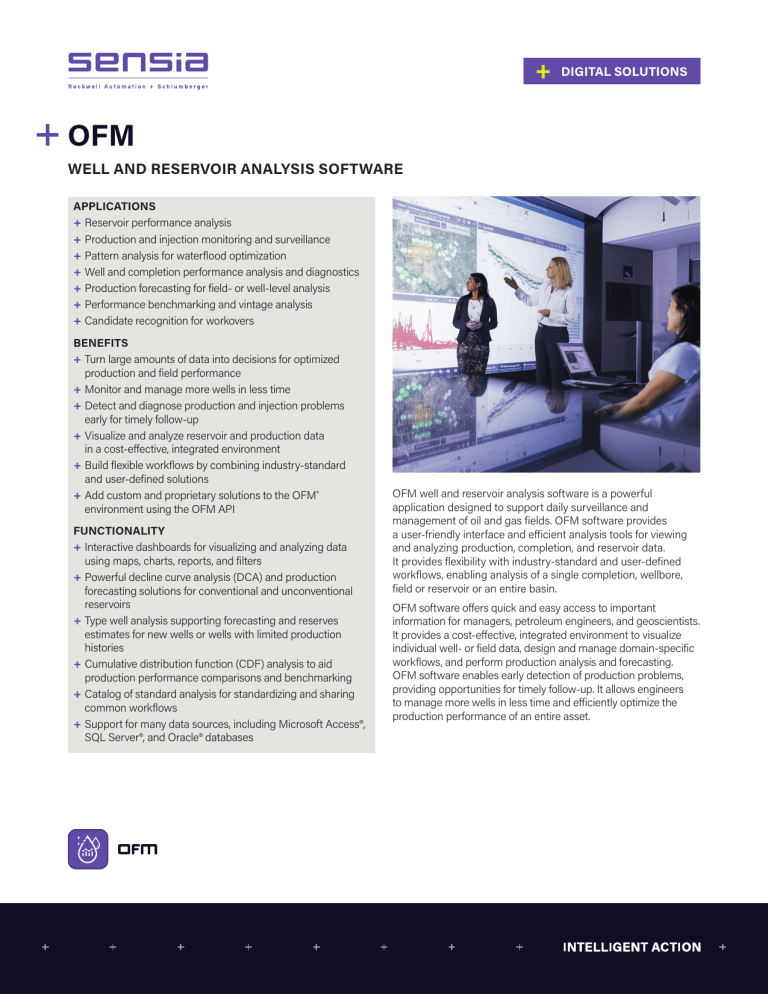
DIGITAL SOLUTIONS OFM WELL AND RESERVOIR ANALYSIS SOFTWARE APPLICATIONS + Reservoir performance analysis + Production and injection monitoring and surveillance + Pattern analysis for waterflood optimization + Well and completion performance analysis and diagnostics + Production forecasting for field- or well-level analysis + Performance benchmarking and vintage analysis + Candidate recognition for workovers BENEFITS + Turn large amounts of data into decisions for optimized production and field performance + Monitor and manage more wells in less time + Detect and diagnose production and injection problems early for timely follow-up + Visualize and analyze reservoir and production data in a cost‑effective, integrated environment + Build flexible workflows by combining industry-standard and user-defined solutions + Add custom and proprietary solutions to the OFM* environment using the OFM API FUNCTIONALITY + Interactive dashboards for visualizing and analyzing data using maps, charts, reports, and filters + Powerful decline curve analysis (DCA) and production forecasting solutions for conventional and unconventional reservoirs + Type well analysis supporting forecasting and reserves estimates for new wells or wells with limited production histories + Cumulative distribution function (CDF) analysis to aid production performance comparisons and benchmarking + Catalog of standard analysis for standardizing and sharing common workflows + Support for many data sources, including Microsoft Access®, SQL Server®, and Oracle® databases OFM well and reservoir analysis software is a powerful application designed to support daily surveillance and management of oil and gas fields. OFM software provides a user-friendly interface and efficient analysis tools for viewing and analyzing production, completion, and reservoir data. It provides flexibility with industry-standard and user-defined workflows, enabling analysis of a single completion, wellbore, field or reservoir or an entire basin. OFM software offers quick and easy access to important information for managers, petroleum engineers, and geoscientists. It provides a cost-effective, integrated environment to visualize individual well- or field data, design and manage domain-specific workflows, and perform production analysis and forecasting. OFM software enables early detection of production problems, providing opportunities for timely follow-up. It allows engineers to manage more wells in less time and efficiently optimize the production performance of an entire asset. OFM Well and Reservoir Analysis Software INTERACTIVE DASHBOARDS FOR IMPROVED DECISION MAKING The OFM analysis dashboard provides an interactive environment for visualizing and analyzing multidimensional data in one place. Key OFM functionality includes charting, reporting, and filtering and a robust mapping module. These functions, which form the basis for all analysis, are essential for advanced production analysis, decline curve analysis, and forecasting. The OFM software offers a full portfolio of tools and an interactive and efficient solution for applying them. Charting, reporting, and filtering There are several types of charts available, including line, scatter, and bar charts, as well as stacked charts. Reporting options include exception-based reports and reports with custom filtering and conditional highlighting. Project filters define the dataset and number of completions used during an OFM session, and additional filtering options allow the user to quickly drill down to a smaller area of interest for analysis. Mapping Mapping The mapping module enables stacked layers of different types of data, such as well symbols, deviations, bubble maps, grid maps, well spacing information, and annotations, on a GIS or non-GIS background. Users can connect to public or private map servers or bring in shapefiles to develop data insights. The mapping techniques include multidimensional capabilities for controlling color, shape, and size to get deeper insight into the areal trend. If the parameter is time-dependent, animation can highlight trends by displaying the changes over time. Decline curve analysis (DCA) The forecast module combines the classic OFM functionality for Arps, calculated forecast, and ratio analysis with type wells and unconventional methods: Duong, power law, and stretched exponential decline (SEPD). The classic DCA and forecasting work together with the new dashboard DCA analysis. Decline curve analysis Type well analysis The type well analysis module enables the user to create and save probabilistic type well curves (e.g., P10, P50, P90) for a group of wells or categories. The type wells can then be included in a forecasting schedule for existing or planned wells or in a line plot to compare with newly drilled wells. The user can also apply a normalization factor to the type well variable for improved forecasting. Cumulative distribution function (CDF) The CDF tool enables statistical analysis in the dashboard. CDF curves give the distribution of a variable, and the display shows its percentage rank in this distribution. The user can create CDF curves (or histograms) for any group of wells or categories. Type well analysis OFM Well and Reservoir Analysis Software OFM Solutions The OFM software provides a large portfolio of modules, features and functions, but the key offering is the ability to bring it all together in the form of an OFM solution. OFM solutions are integrated workflows that link multidomain data for rapid screening, production performance analysis, and field-level production optimization. + Flexible workflows: OFM software supports industrystandard workflows and solutions as well as user-defined workflows designed specifically for a local need, for example, production benchmarking, workover candidate recognition, and liquid loading detection. + Interactive analysis dashboards: The OFM analysis dashboard enables visualization and analysis of large datasets, with production, injection, completion, and reservoir data in a single, interactive environment, displaying multiple chart types and reports simultaneously. + Extensibility: The OFM application programming interface (API) provides the opportunity for a user to add custom and proprietary solutions to the OFM environment with the creation of plug-in analyses and functions. + Integration: Integration with industry-renowned software including the Avocet* production operations software platform, the Petrel* E&P software platform, and the Peep module in Merak* planning, risk, and reserves software enables collaboration across domains. OFM analysis dashboard with mapping, decline curve analysis, and charting sensiaglobal.com Add intelligent action to your oil & gas solutions © Sensia LLC 2021. All rights reserved. 14B-DG-0324-PS *Mark of Sensia. Merak and Petrel are marks of Schlumberger. Other company, product, and service names are the properties of their respective owners.


