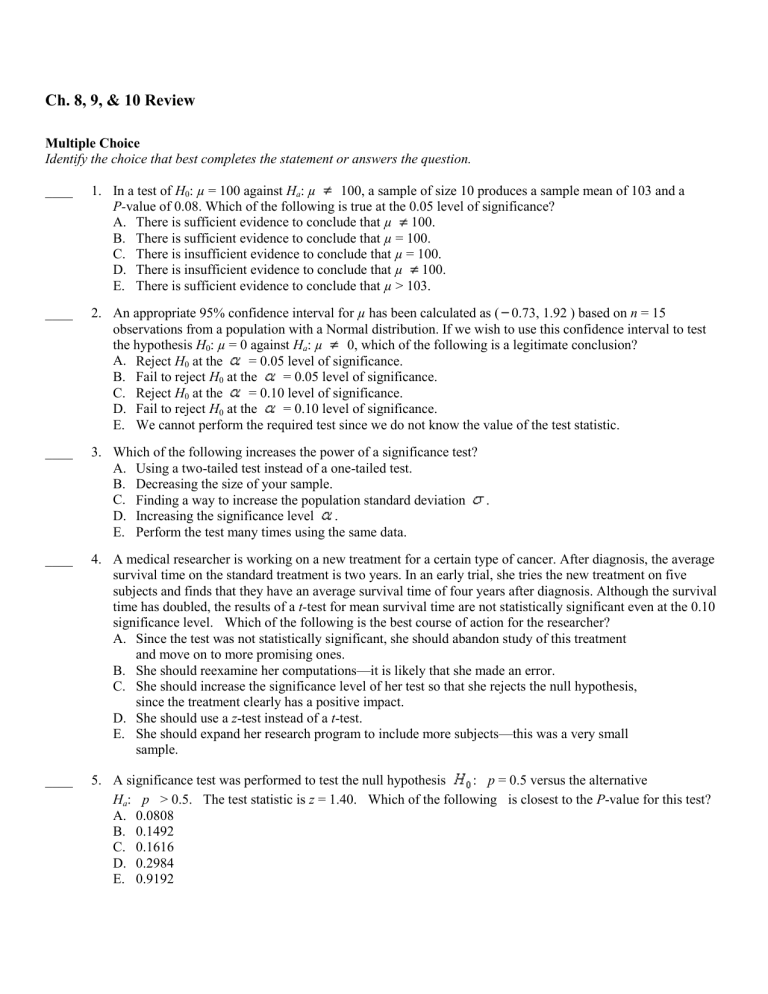
Ch. 8, 9, & 10 Review Multiple Choice Identify the choice that best completes the statement or answers the question. ____ 1. In a test of H0: µ = 100 against Ha: µ 100, a sample of size 10 produces a sample mean of 103 and a P-value of 0.08. Which of the following is true at the 0.05 level of significance? A. There is sufficient evidence to conclude that µ 100. B. There is sufficient evidence to conclude that µ = 100. C. There is insufficient evidence to conclude that µ = 100. D. There is insufficient evidence to conclude that µ 100. E. There is sufficient evidence to conclude that µ > 103. ____ 2. An appropriate 95% confidence interval for µ has been calculated as ( 0.73, 1.92 ) based on n = 15 observations from a population with a Normal distribution. If we wish to use this confidence interval to test the hypothesis H0: µ = 0 against Ha: µ 0, which of the following is a legitimate conclusion? A. Reject H0 at the = 0.05 level of significance. B. Fail to reject H0 at the = 0.05 level of significance. C. Reject H0 at the = 0.10 level of significance. D. Fail to reject H0 at the = 0.10 level of significance. E. We cannot perform the required test since we do not know the value of the test statistic. ____ 3. Which of the following increases the power of a significance test? A. Using a two-tailed test instead of a one-tailed test. B. Decreasing the size of your sample. C. Finding a way to increase the population standard deviation . D. Increasing the significance level . E. Perform the test many times using the same data. ____ 4. A medical researcher is working on a new treatment for a certain type of cancer. After diagnosis, the average survival time on the standard treatment is two years. In an early trial, she tries the new treatment on five subjects and finds that they have an average survival time of four years after diagnosis. Although the survival time has doubled, the results of a t-test for mean survival time are not statistically significant even at the 0.10 significance level. Which of the following is the best course of action for the researcher? A. Since the test was not statistically significant, she should abandon study of this treatment and move on to more promising ones. B. She should reexamine her computations—it is likely that she made an error. C. She should increase the significance level of her test so that she rejects the null hypothesis, since the treatment clearly has a positive impact. D. She should use a z-test instead of a t-test. E. She should expand her research program to include more subjects—this was a very small sample. ____ 5. A significance test was performed to test the null hypothesis : p = 0.5 versus the alternative Ha: p > 0.5. The test statistic is z = 1.40. Which of the following is closest to the P-value for this test? A. 0.0808 B. 0.1492 C. 0.1616 D. 0.2984 E. 0.9192 ____ 6. A test of produces a sample mean of = 0.05 level, which of the following is an appropriate conclusion? A. There is sufficient evidence to conclude that µ < 60. B. There is sufficient evidence to conclude that µ = 60. C. There is insufficient evidence to conclude that µ = 60. D. There is insufficient evidence to conclude that µ 60. E. There is sufficient evidence to conclude that µ 60. and a P-value of 0.04. At an ____ 7. Which of the following statements is/are correct? I. The power of a significance test depends on the alternative value of the parameter. II. The probability of a Type II error is equal to the significance level of the test. III. Error probabilities can be expressed only when a significance level has been specified. A. I and II only B. I and III only C. II and III only D. I, II, and III E. None of the above gives the complete set of correct responses. Scenario 9-1 The water diet requires one to drink two cups of water every half hour from the time one gets up until one goes to bed, but otherwise allows one to eat whatever one likes. Four adult volunteers agree to test the diet. They are weighed prior to beginning the diet and after six weeks on the diet. The weights (in pounds) are Subject Weight before diet Weight after 6 weeks A 180 170 B 125 130 C 240 215 D 150 152 ____ 8. Use Scenario 9-1. Which of the following conditions must be met in order to use a t-procedure on these paired data? A. Only the distribution of pre-diet weights must be approximately Normal. B. Only the distribution of differences (after 6 weeks – before) must be approximately Normal. C. The distribution of both pre-diet weights and six-week weights must be approximately Normal. D. The distribution of pre-diet weights and the distribution of differences (after 6 weeks – before) must be approximately Normal. E. All three distributions—before diet, after 6 weeks, and the difference—must be approximately Normal. ____ 9. Use Scenario 9-1. What would a Type II error be in this setting? A. Concluding that the diet leads to weight loss when it doesn’t. B. Concluding that the diet leads to weight loss when it really does. C. Not concluding that the diet leads to weight loss when it does. D. Not concluding that the diet leads to weight loss when it really doesn’t. E. Drawing a conclusion from this test when the Normality condition has not been satisfied. ____ 10. The recommended daily Calcium intake for women over 21 (and under 50) is 1000 mg per day. The health services at a college are concerned that women at the college get less Calcium than that, so they take a random sample of female students in order to test the hypotheses versus . Prior to the study they estimate that the power of their test against the alternative Which of the following is the best interpretation of this value? A. The probability of making a Type II error. B. The probability of rejecting the null hypothesis when the parameter value is 1000. C. The probability of rejecting the null hypothesis when the parameter value is 900. D. The probability of failing to reject the null hypothesis when the parameter value is 1000. E. The probability of failing to reject the null hypothesis when the parameter value is 900. is 0.85. Scenario 9-2 Resting pulse rate is an important measure of the fitness of a person's cardiovascular system, with a lower rate indicative of greater fitness. The mean pulse rate for all adult males is approximately 72 beats per minute. A random sample of 25 male students currently enrolled in the Agriculture School at a major university was selected and the mean resting pulse rate was found to be 80 beats per minute with a standard deviation of 20 beats per minute. The experimenter wishes to test if the students are less fit, on average, than the general population. ____ 11. Use Scenario 9-2. The null and alternative hypotheses are A. B. C. D. E. ____ 12. Use Scenario 9-2. Which of the following describes a Type II error in this setting? A. Concluding that the students are less fit (on average) than the general population when in fact they have equal fitness on average. B. Not concluding that the students are less fit (on average) as the general population when in fact they are less fit (on average). C. Not concluding that the students are less fit (on average) as the general population when in fact they have the same fitness (on average). D. Concluding that the students are less fit (on average) than the general population, when, in fact, they are less fit (on average). E. Concluding that the students have the same fitness (on average) when in fact they are more fit (on average). ____ 13. A significance test was performed to test the null hypothesis H0: µ = 2 versus the alternative Ha: µ 2. A sample of size 28 produced a test statistic is t = 2.051. Assuming all conditions for inference were met, which of the following intervals contains the P-value for this test? A. B. C. D. E. ____ 14. Looking online, you find the salaries of all 25 players for the Chicago Cubs as of opening day of the 2005 baseball season. The club total was $87 million, eighth in the major leagues. Which inference procedure would you use to estimate the average salary of the Cubs players? A. One-sample z interval for B. One-sample t interval for C. One-sample t test D. One-sample z test E. None of these—this is not a situation that calls for inference. ____ 15. A city planner is comparing traffic patterns at two different intersections. He randomly selects 12 times between 6 am and 10 pm, and he and his assistant count the number of cars passing through each intersection during the 10-minute interval that begins at that time. He plans to test the hypothesis that the mean difference in the number of cars passing through the two intersections during each of those 12 times intervals is 0. Which of the following is appropriate test of the city planner’s hypothesis? A. Two-proportion z-test B. Two-sample z-test C. Matched pairs t-test D. Two proportion t-test E. Two-sample t-test ____ 16. Popular wisdom is that eating presweetened cereal tends to increase the number of dental caries (cavities) in children. A sample of children was (with parental consent) entered into a study and followed for several years. Each child was classified as a sweetened-cereal lover or a unsweetened cereal lover. At the end of the study, the amount of tooth damage was measured. Here are the summary data: Cereal preference Sweetened Unsweetened n 10 15 Mean 6.41 5.20 Std. Dev. 5.0 15.0 Assuming the necessary conditions for inference are met, which of the following is an approximate 95% confidence interval for the difference in the mean tooth damage? A. B. C. D. E. Scenario 10-2 Janice and her cousin Linda are a little competitive about the relative merits of their home towns. One contest they had was to determine who had more rainy days. They found weather records on the internet and each of them randomly selected 60 days from the past 5 years. Janice found that there had been measurable rainfall on 17 of the 60 days she selected for Asheville, and Linda found that there had been measurable rainfall on 12 of the 60 days she selected for Lincoln. They intend to perform a test of significance on their data, using the hypotheses and the 0.05 significance level. ____ 17. Use Scenario 10-2. When calculating the test statistic, what expression would they use to estimate the standard deviation of the sampling distribution of the difference in proportions, ? A. B. C. D. E. ____ 18. Use Scenario 10-2. Janice and Linda’s test statistic is 1.07. Which of the following is closest to the appropriate P-value for the test? A. 0.0446 B. 0.0892 C. 0.1423 D. 0.1449 E. 0.2846 ____ 19. Use Scenario 10-2. Which of the following best describes what it would mean if Janice and Linda’s test resulted in a Type I error? A. Concluding that there is a difference in the proportion of rainy days in the two cities when there is no difference. B. Concluding that there is no difference in the proportion of rainy days in the two cities when there is a difference. C. Choosing the wrong test procedure, such as using a z-test instead of a t-test. D. Accepting the alternative hypothesis instead of rejecting the null hypothesis. E. Accepting the null hypothesis instead of rejecting the alternative hypothesis. Scenario 10-3 The Excellent Drug Company claims its aspirin tablets will relieve headaches faster than any other aspirin on the market. To determine whether Excellent’s claim is valid, 30 volunteers who are suffering from headaches are randomly assigned to two groups. The subjects in one group are given Excellent’s aspirin, and the subjects in the other group are given aspirin from the Simple Drug company. The number of minutes required for each subject to recover from the headache is recorded. A 5% significance level test is performed to determine whether Excellent’s aspirin cures headaches significantly faster than Simple's aspirin. The data were analyzed with MINITAB, and the following output was obtained: Excellent Simple N 15 15 Mean 8.4 8.9 StDev 4.23 4.61 SE Mean 1.092 1.190 Difference = mu (Excellent) - mu (Simple) Estimate for difference: -0.5 T-Test of difference = 0 (vs not =): T-Value = -0.380 = 27.8 P-Value = 0.3796 DF ____ 20. Use Scenario 10-3. Which of the following is the most appropriate conclusion to draw at the = 0.05 level? A. Reject H0: there is sufficient evidence that Excellent cures headaches faster than Simple. B. Accept Ha: there is sufficient evidence that Excellent cures headaches faster than Simple. C. Accept Ha: there is insufficient evidence to conclude that Excellent cures headaches faster than Simple. D. Fail to reject H0: there is sufficient evidence that Excellent cures headaches faster than Simple. E. Fail to reject H0: there is insufficient evidence to conclude that Excellent cures headaches faster than Simple. ____ 21. All of us nonsmokers can rejoice—the mosaic tobacco virus that affects and injures tobacco plants is spreading! Meanwhile, a tobacco company is investigating if a new treatment is effective in reducing the damage caused by the virus. Eleven plants were randomly chosen. On each plant, one leaf was randomly selected, and one half of the leaf (randomly chosen) was coated with the treatment, while the other half was left untouched (control). After two weeks, the amount of damage to each half of the leaf was assessed. For purposes of comparing the damage, which of the following is the appropriate type of procedure? A. Two-proportion z procedures B. Two-sample z procedures C. Matched pairs t procedures D. Two proportion t procedures E. Two-sample t procedures ____ 22. A researcher wants to see if birds that build larger nests lay larger eggs. She selects two random samples of nests: one of small nests and the other of large nests. She weighs one egg from each nest. The data are summarized below. Small nests Large nests n 60 159 Mean (gm) 37.2 35.6 Std. Dev. (gm) 4.97 6.24 Which of the following represents a 95% confidence interval for the difference between the average mass of eggs in small and large nests? A. B. C. D. E. Scenario 10-5 Sixty-eight people from a random sample of 128 residents of Uppsala, Sweden, had blue eyes. 45 people from a random sample of 110 people from Preston, England, had blue eyes. Let represent the proportion of people in Uppsala with blue eyes, and let represent the proportion of people in Preston with blue eyes. ____ 23. Use Scenario 10-5. The P-value for this test is 0.06. If the researchers chose a significance level of 0.05, which of the following represents the correct conclusion to draw from this result? A. Reject : there is evidence to suggest a difference in the proportion of blue-eyed people in these two countries. B. Fail to reject : there is convincing evidence to suggest a difference in the proportion of blue-eyed people in these two countries. C. Fail to reject : there is insufficient evidence to suggest a difference in the proportion of blue-eyed people in these two countries. D. Accept Ha: there is convincing evidence to suggest a difference in the proportion of blue-eyed people in these two countries. E. Accept H0: there is insufficient evidence to suggest a difference in the proportion of blue-eyed people in these two countries. ____ 24. The following are percents of fat found in 5 samples of each of two brands of ice cream: A B 5.7 6.3 4.5 5.7 6.2 5.9 6.3 6.4 7.3 5.1 Which of the following procedures is appropriate to test the hypothesis of equal average fat content in the two types of ice cream? A. Paired t test with 5 df. B. Two-sample t test with 4 df. C. Paired t test with 4 df. D. Two-sample t test with 9 df. E. Two-proportion z test Ch. 8, 9, & 10 Review Answer Section MULTIPLE CHOICE 1. 2. 3. 4. 5. 6. 7. 8. 9. 10. 11. 12. 13. 14. 15. 16. 17. 18. 19. 20. 21. 22. 23. 24. D B D E A E B B C C E B E E C B D E A E C A C B
