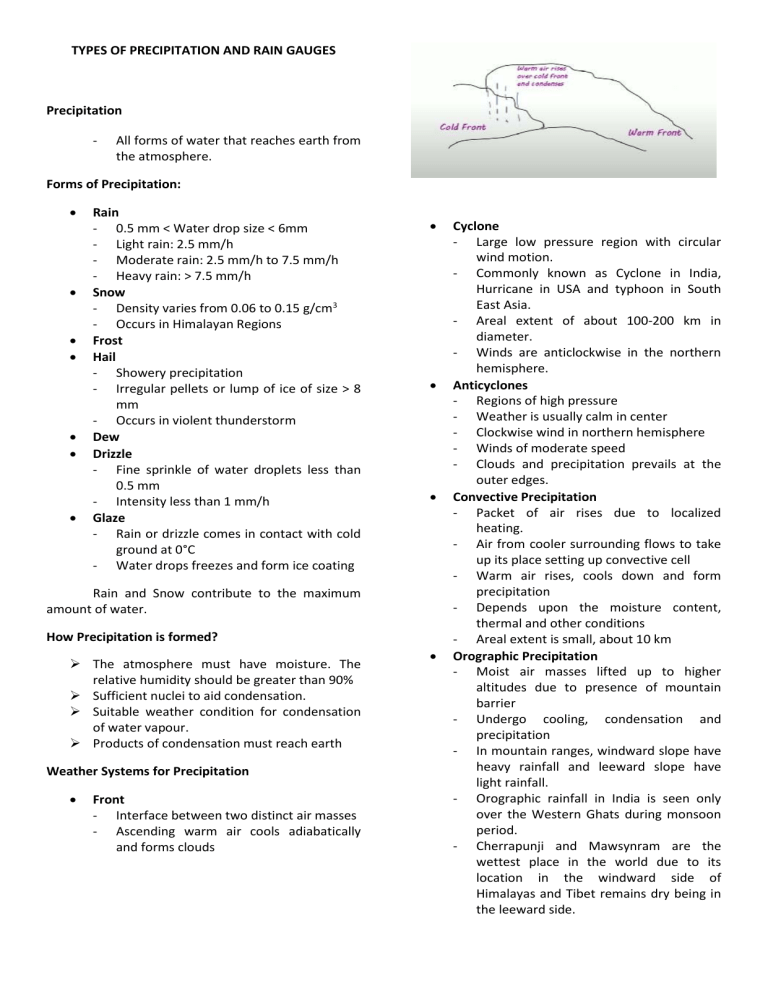
TYPES OF PRECIPITATION AND RAIN GAUGES Precipitation - All forms of water that reaches earth from the atmosphere. Forms of Precipitation: Rain - 0.5 mm < Water drop size < 6mm - Light rain: 2.5 mm/h - Moderate rain: 2.5 mm/h to 7.5 mm/h - Heavy rain: > 7.5 mm/h Snow - Density varies from 0.06 to 0.15 g/cm3 - Occurs in Himalayan Regions Frost Hail - Showery precipitation - Irregular pellets or lump of ice of size > 8 mm - Occurs in violent thunderstorm Dew Drizzle - Fine sprinkle of water droplets less than 0.5 mm - Intensity less than 1 mm/h Glaze - Rain or drizzle comes in contact with cold ground at 0°C - Water drops freezes and form ice coating Rain and Snow contribute to the maximum amount of water. How Precipitation is formed? The atmosphere must have moisture. The relative humidity should be greater than 90% Sufficient nuclei to aid condensation. Suitable weather condition for condensation of water vapour. Products of condensation must reach earth Weather Systems for Precipitation Front - Interface between two distinct air masses - Ascending warm air cools adiabatically and forms clouds Cyclone - Large low pressure region with circular wind motion. - Commonly known as Cyclone in India, Hurricane in USA and typhoon in South East Asia. - Areal extent of about 100-200 km in diameter. - Winds are anticlockwise in the northern hemisphere. Anticyclones - Regions of high pressure - Weather is usually calm in center - Clockwise wind in northern hemisphere - Winds of moderate speed - Clouds and precipitation prevails at the outer edges. Convective Precipitation - Packet of air rises due to localized heating. - Air from cooler surrounding flows to take up its place setting up convective cell - Warm air rises, cools down and form precipitation - Depends upon the moisture content, thermal and other conditions - Areal extent is small, about 10 km Orographic Precipitation - Moist air masses lifted up to higher altitudes due to presence of mountain barrier - Undergo cooling, condensation and precipitation - In mountain ranges, windward slope have heavy rainfall and leeward slope have light rainfall. - Orographic rainfall in India is seen only over the Western Ghats during monsoon period. - Cherrapunji and Mawsynram are the wettest place in the world due to its location in the windward side of Himalayas and Tibet remains dry being in the leeward side. Measurement of Precipitation Expressed in terms of depth to which rainfall water would stand on an area if all the rain are collected on it. It is collected and measured in a rain gauge. Other terns are pluviometer, ombrometer and hyetometer. It consist of a cylindrical-vessel assembly kept in the open to collect rain Classifies into non-recording gauges and recording gauges. Non-Recording Rain Gauges - - - Symon’s Gauge is commonly used in India It consists of a circular collecting area of 12.7 cm(5.0 inch) diameter and height 30.5 cm. The rainfall is measured every day at 8:30 a.m. and is recorded as the rainfall of that day. Can also measure snowfall. Recording Rain Gauges Recording gauges produces a continuous plot of rainfall against time. Provides data of intensity and duration of rainfall for hydrological analysis. Tipping-Bucket Type - A 30.5 cm size Rain Gauge - Buckets are balances such that when 0.25 mm of rainfall collects in one bucket, it tips and bring the other one in position. Weighing-Bucket Type - Plot of accumulated rainfall against elapsed time. Neutral-Syphon Type - Also called as float rain gauge - Adopted as standard rain gauge in India - Gives plot of mass curve of rainfall. Telemetering Rain Gauges - Gather rainfall data from mountainous regions and inaccessible places. HYDROLOGY TOPIC 2-3-5 PRECIPITATION DATA ANALYSIS / POINT PRECIPITATION / MEAN AREAL RAINFALL Mean Areal Rainfall The representative precipitation over a defined area is required in engineering application, whereas the gaged observation pertains to the point precipitation Arithmetic Mean Method - This procedure is satisfactory if gauges are uniformly distributed and the topography is flat. Isohyetal Method Thiessen Polygon Method The reliability of rainfall measured at one gauge in representing the average depth over a surrounding area is a function of the distance from the gauge to the center of the representative area, the size of the area, topography, the nature of the rainfall of concern, and local stone pattern characteristics. Arithmetic Mean Method - It uses only those gaging stations within the topographic basin and is calculated using: 𝑃= (𝑃1 + 𝑃2 + 𝑃3 + ⋯ + 𝑃𝑛 𝑛 or 𝑃 𝑃 = ∑ 𝑛𝑖 Where, P = average precipitation depth (mm) Pi = precipitation depth at gage (i) within the topographic basin (mm) n = total number of gaging stations within the topographic basin Thiessen Polygon Method - This concept is implemented by drawing perpendicular bisectors to straight lines connecting each two rain gages. The procedure involves: 1. Connecting each precipitation station with straight lines; 2. Constructing perpendicular bisectors of the connecting lines and forming polygons with these bisectors; 3. The area of the polygon is determined. 𝑃= 𝐴1 𝑃1 + 𝐴2 𝑃2 + 𝐴3 𝑃3 + ⋯ + 𝐴𝑛 𝑃𝑛 𝐴1 + 𝐴2 + 𝐴3 + ⋯ + 𝐴𝑛 𝑛 = ∑ 𝑖=1 ∑ 𝑃𝑟𝑒𝑐𝑖𝑝𝑖𝑡𝑎𝑡𝑖𝑜𝑛 = 𝐴𝑖 𝑃𝑖 𝐴 𝑃𝑜𝑙𝑦𝑔𝑜𝑛 𝑎𝑟𝑒𝑎 𝑓𝑜𝑟 𝑒𝑎𝑐ℎ 𝑠𝑡𝑎𝑡𝑖𝑜𝑛 𝑥 𝑝𝑟𝑒𝑐𝑖𝑝𝑖𝑡𝑎𝑡𝑖𝑜𝑛 ∑ 𝑇𝑜𝑡𝑎𝑙 𝑃𝑜𝑙𝑦𝑔𝑜𝑛 𝑎𝑟𝑒𝑎 Isohyetal Method - Based on interpolation between gauges. - The first step is to plot the rain gauge locations on a suitable map to record the rainfall amounts. - Next, an interpolation between gauges is performed and rainfall amounts at selected increments are plotted. - Identical depths from each interpolation are then connected to for isohyets. The areal average is the weighted average of depths between isohyets. 𝑃= HYDROLOGY TOPIC 2-3-4 PRECIPITATION DATA ANALYSIS / MISSING RAINFALL DATA / DOUBLE MASS CURVE Rain Gauge Inconsistency Have been installed at different sites in the past, The rainfall depth is being recorded continuously between the previous and the current sites. The entire data is not homogeneous. Change of exposure conditions of the gage due to growth of the trees or the construction of tall buildings in the proximity of the gage site, or Change in the instrument, or The rain gauge may have been faulty for a part of the period of record. Double Mass Curve 𝑃0 + 𝑃1 𝑃 + 𝑃2 𝑃 + 𝑃𝑛 𝐴1 + 1 𝐴2 + ⋯ + 𝑛−1 𝐴𝑛 2 2 2 𝐴1 + 𝐴2 + ⋯ + 𝐴1 or 𝑃= ∑𝑛𝑖=1 𝑃𝑖−1 + 𝑃𝑖 𝐴𝑖 2 ∑𝑛𝑖=1 𝐴𝑖 Or 𝑃= ∑𝑛𝑖=1 𝑃𝑖−1 + 𝑃𝑖 2 𝐴 𝑃𝑎 = 𝑃𝑜 Where 𝑀0 = ∆𝑃𝑜 ∆𝑃 𝑀𝑎 = ∆𝑃𝑎 ∆𝑃 Where, P = mean areal precipitation A = Area P1, P2, … Pn = precipitation depth for each station A1, A2, … An -= Area of each site 𝑀𝑎 𝑀𝑜
