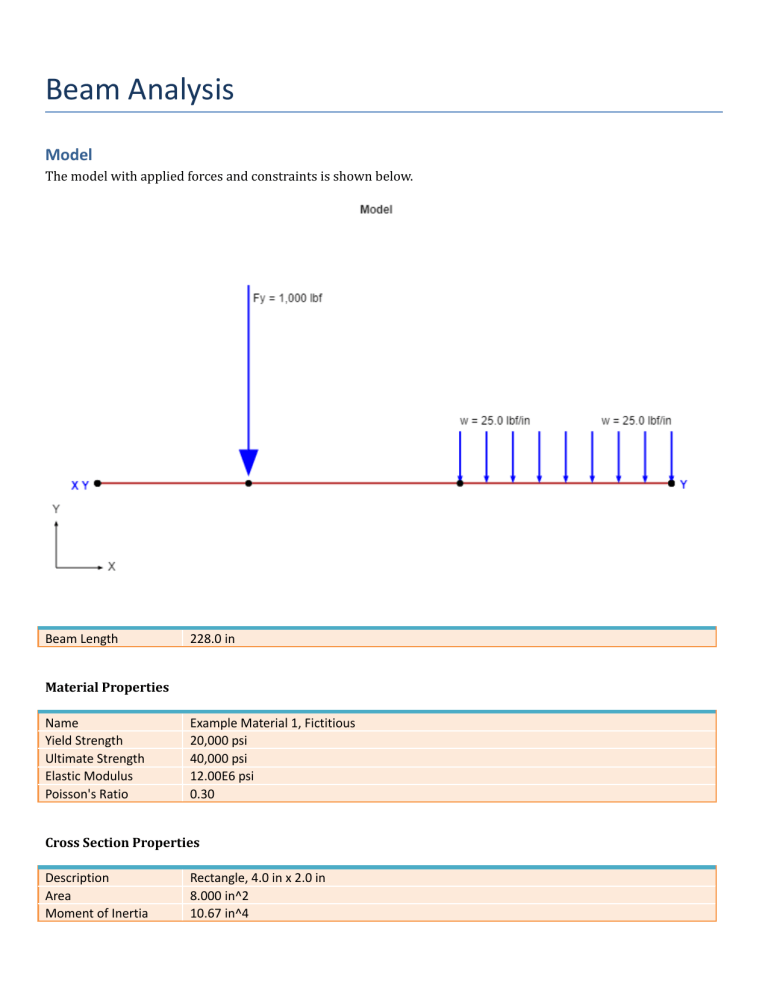
Beam Analysis Model The model with applied forces and constraints is shown below. Beam Length 228.0 in Material Properties Name Yield Strength Ultimate Strength Elastic Modulus Poisson's Ratio Example Material 1, Fictitious 20,000 psi 40,000 psi 12.00E6 psi 0.30 Cross Section Properties Description Area Moment of Inertia Rectangle, 4.0 in x 2.0 in 8.000 in^2 10.67 in^4 Results Overview The max displacement and slope are given below. Max Displacement Max Slope Value 3.414 in 2.932 deg Location 116.0 in 228.0 in The Free Body Diagram (FBD) and deformed mesh are shown below. Shear-Moment Diagram The shear and moment diagrams are shown below. The standard sign conventions for shear-moment diagrams are followed: ● ● Shear: Positive shear causes clockwise rotation of the beam, negative shear causes counter-clockwise rotation. Moment: Positive moment will compress the top of the beam and elongate the bottom of the beam (i.e. make the beam "smile"). Shear Peak Values Location 0.000 in 60.00 in 60.00 in 144.0 in 228.0 in Value 1,124 lbf 1,124 lbf 123.7 lbf 123.7 lbf -1,909 lbf Moment Peak Values Location 146.8 in Value 77,967 in*lbf Stress Plots The stress plots are shown below. Displacement Plots The displacement plots are shown below. The sign convention for displacements is: ● ● ● X: Positive to right, negative to left Y: Positive up, negative down Rotation: Right hand rule (positive counterclockwise, negative clockwise)
