Extraction, Isolation, and Characterization of Pectin from Citrus Peels Torres, Dan Paul Aaron B pdf
advertisement

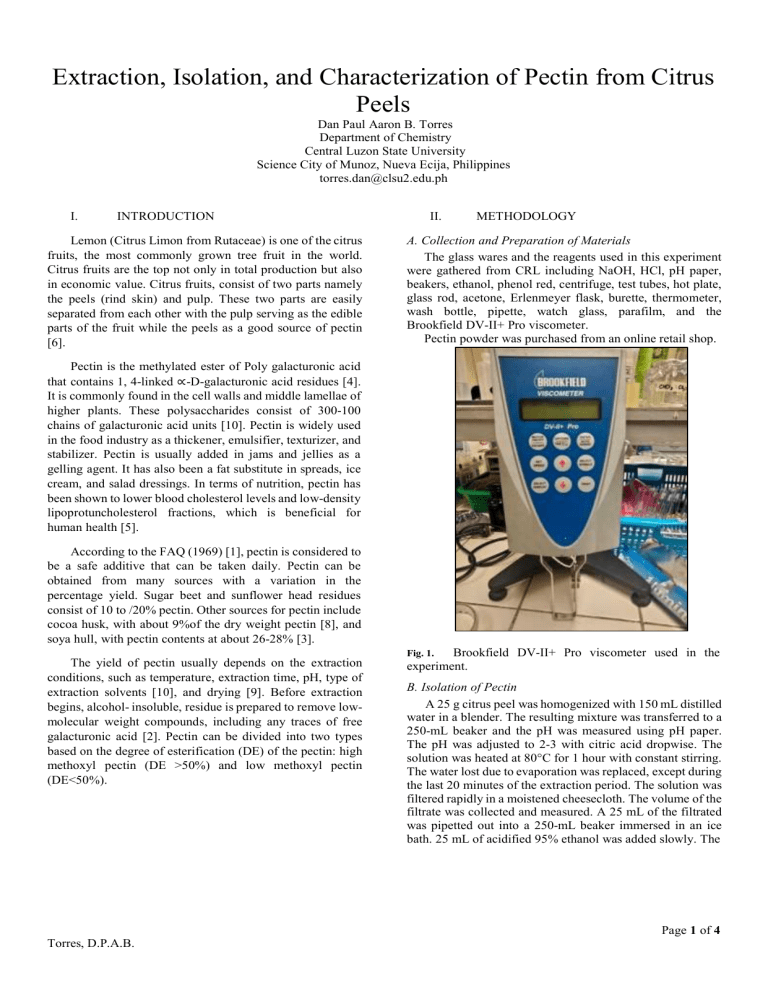
Extraction, Isolation, and Characterization of Pectin from Citrus Peels Dan Paul Aaron B. Torres Department of Chemistry Central Luzon State University Science City of Munoz, Nueva Ecija, Philippines torres.dan@clsu2.edu.ph I. INTRODUCTION Lemon (Citrus Limon from Rutaceae) is one of the citrus fruits, the most commonly grown tree fruit in the world. Citrus fruits are the top not only in total production but also in economic value. Citrus fruits, consist of two parts namely the peels (rind skin) and pulp. These two parts are easily separated from each other with the pulp serving as the edible parts of the fruit while the peels as a good source of pectin [6]. II. METHODOLOGY A. Collection and Preparation of Materials The glass wares and the reagents used in this experiment were gathered from CRL including NaOH, HCl, pH paper, beakers, ethanol, phenol red, centrifuge, test tubes, hot plate, glass rod, acetone, Erlenmeyer flask, burette, thermometer, wash bottle, pipette, watch glass, parafilm, and the Brookfield DV-II+ Pro viscometer. Pectin powder was purchased from an online retail shop. Pectin is the methylated ester of Poly galacturonic acid that contains 1, 4-linked ∝-D-galacturonic acid residues [4]. It is commonly found in the cell walls and middle lamellae of higher plants. These polysaccharides consist of 300-100 chains of galacturonic acid units [10]. Pectin is widely used in the food industry as a thickener, emulsifier, texturizer, and stabilizer. Pectin is usually added in jams and jellies as a gelling agent. It has also been a fat substitute in spreads, ice cream, and salad dressings. In terms of nutrition, pectin has been shown to lower blood cholesterol levels and low-density lipoprotuncholesterol fractions, which is beneficial for human health [5]. According to the FAQ (1969) [1], pectin is considered to be a safe additive that can be taken daily. Pectin can be obtained from many sources with a variation in the percentage yield. Sugar beet and sunflower head residues consist of 10 to /20% pectin. Other sources for pectin include cocoa husk, with about 9%of the dry weight pectin [8], and soya hull, with pectin contents at about 26-28% [3]. Brookfield DV-II+ Pro viscometer used in the experiment. Fig. 1. The yield of pectin usually depends on the extraction conditions, such as temperature, extraction time, pH, type of extraction solvents [10], and drying [9]. Before extraction begins, alcohol- insoluble, residue is prepared to remove lowmolecular weight compounds, including any traces of free galacturonic acid [2]. Pectin can be divided into two types based on the degree of esterification (DE) of the pectin: high methoxyl pectin (DE >50%) and low methoxyl pectin (DE<50%). B. Isolation of Pectin A 25 g citrus peel was homogenized with 150 mL distilled water in a blender. The resulting mixture was transferred to a 250-mL beaker and the pH was measured using pH paper. The pH was adjusted to 2-3 with citric acid dropwise. The solution was heated at 80°C for 1 hour with constant stirring. The water lost due to evaporation was replaced, except during the last 20 minutes of the extraction period. The solution was filtered rapidly in a moistened cheesecloth. The volume of the filtrate was collected and measured. A 25 mL of the filtrated was pipetted out into a 250-mL beaker immersed in an ice bath. 25 mL of acidified 95% ethanol was added slowly. The Page 1 of 4 Torres, D.P.A.B. mixture was stirred continuously for 10 minutes. For 10 minutes, the mixture was then centrifuged at maximum speed. The supernatant was decanted. The precipitate was washed with 10 mL acidified 70% ethanol. The precipitate was washed three times with 5 mL 95% ethanol. Finally, the precipitate was washed with 3 mL acetone. The extract was lyophilized overnight. The precipitate was weighed. The percent yield in the original filtrate was determined. III. RESULTS AND DISCUSSION A. Determination of Equivalent Weight The change in color during the titration of the pectin solution was shown in Figure 1 and Figure 2. In which, as seen in Figure 1, a yellowish solution was observed, while in Figure 2, the neutralized solution observed was strong pink. C. Determination of Equivalent Weight A 0.5g of the precipitate obtained from the isolation of pectin was taken into a 250-mL conical flask and 5 mL of ethanol was added. A 1.0g of sodium chloride and 100 ml of water were added. Six (6) drops of 0.4% phenol red indicator were added to the solution. Using 0.1 N NaOH, the sample was titrated. The appearance of pink color was an indication of the titration endpoint. This is labeled as a ‘neutralized solution’ and this was stored for the determination of methoxy content. The formula below was used for the calculation of equivalent weight. 𝑤𝑒𝑖𝑔ℎ𝑡 𝑜𝑓 𝑡ℎ𝑒 𝑠𝑎𝑚𝑝𝑙𝑒 (𝑔) × 100 𝐸𝑞𝑢𝑖𝑣 𝑙 𝑛𝑡 𝑤 𝑖𝑔ℎ𝑡 = 𝑚𝐿 𝑜𝑓 𝑎𝑙𝑘𝑎𝑙𝑖 × 𝑁 𝑜𝑓 𝑎𝑙𝑘𝑎𝑙𝑖 D. Determination of Methoxy Content The ‘neutralized solution’ was collected from the determination of equivalent weight, and 10 mL of standardized 0.1 N of sodium hydroxide was added. The resulting mixture was stirred thoroughly and incubated at room temperature for 30 minutes. After 30 minutes, 10 mL of 0.1 N HCl was added. Using 0.1 N NaOH, the resulting solution was titrated. The methoxy content was calculated using the formula below. 𝑚 𝑡ℎ𝑜 𝑦 (%) = Fig. 2. Mixture of Pectin Solution from the Determination of Equivalent Weight 𝑚𝐿 𝑜𝑓 𝑎𝑙𝑘𝑎𝑙𝑖 × 𝑁 𝑜𝑓 𝑎𝑙𝑘𝑎𝑙𝑖 × 100 𝑤𝑒𝑖𝑔ℎ𝑡 𝑜𝑓 𝑠𝑎𝑚𝑝𝑙𝑒 (𝑔) E. Viscosity of Pure Solvent A 4-L of 0.10 N NaCl solution was prepared. Around 250-mL of this solution was used for the determination of its viscosity, using the Brookfield DV-II+ Pro viscometer. The remaining solution was used for the succeeding parts of the experiment. F. Viscosity of PVA Standards A 250 mL of 1.5% (w/v) of PVA standard was prepared. From this solution, 0.75%, 0.375%, and 0.1875% serial dilutions (250 mL) were prepared and performed. The remaining 0.10 N NaCl was used in the serial dilution. The viscosity was measured using the Brookfield DV-II+ Pro viscometer. G. Viscosity of Pectin Solutions A 250-mL of 1.5% (w/v) pectin solution was prepared by dissolving dried pectin in 0.1 N NaCl. 0.75%, 0.375%, and 0.1875% serial dilutions (250 mL) were prepared and performed. The viscosity was measured using the Brookfield DV-II+ Pro viscometer. Fig. 3. Neutralized Pectin Solution from the Determination Equivalent Weight. 𝐸𝑞𝑢𝑖𝑣𝑎𝑙 𝑛𝑡 𝑤 𝑖𝑔ℎ𝑡 = 𝑤𝑒𝑖𝑔ℎ𝑡 𝑜𝑓 𝑡ℎ𝑒 𝑠𝑎𝑚𝑝𝑙𝑒 (𝑔) × 100 𝑚𝐿 𝑜𝑓 𝑎𝑙𝑘𝑎𝑙𝑖 × 𝑁 𝑜𝑓 𝑎𝑙𝑘𝑎𝑙𝑖 0.5 𝑔 × 100 𝐸𝑞𝑢𝑖𝑣𝑎𝑙𝑒𝑛𝑡 𝑤𝑒𝑖𝑔ℎ𝑡 = 5.2 𝑚𝐿 × 0.1 𝑁 𝑬𝒒𝒖𝒊𝒗𝒂𝒍𝒆𝒏𝒕 𝒘𝒆𝒊𝒈𝒉𝒕 = 𝟗𝟔. 𝟏𝟓 The equivalent weight of pectin extracted from lemon peel using sodium chloride was found to be 96.15. The high equivalent weight would have a higher gel-forming effect. The lower equivalent weight could be higher partial degradation of pectin. Page 2 of 4 Torres, D.P.A.B. B. Determination of Methoxy Content Solution Blank (0.1N NaCl) Viscosity (cP) 1.8 Temperature (°C) 28.80 Table 1 shows that the viscosity of the 0.1N NaCl at 28.80oC was 1.8 cP. According to the safety data sheet of Lab Chem the viscosity of the 0.1N Nacl was 1.01 cP. D. Viscosity of PVA Standards TABLE II. Solution PVA Standards Fig. 4. The resulting mixture after the addition of 10 mL of 0.1 N HCl. Data for the determination of the viscosity of PVA standards. Concentration (%w/v) 0.75% 0.375% 0.1875% Viscosity (cP) 3.60 3.00 2.40 Temperature (28°C) 28.70 28.60 28.50 Table 2 shows the viscosity of PVA standards at different concentrations. The highest viscosity of PVA at 28oC was 3.60 in 0.75% concentration, and the lowest viscosity of PVA at 28oC was 2.40 in 0.1875% concentration. E. Viscosity of Pectin Solutions TABLE III. Solution Fig. 5. Titration End Point for the Determination of Methoxy Content. 𝑜𝑓𝑜𝑥𝑦 (%) 𝑚𝐿 𝑜𝑓 𝑎𝑙𝑘𝑎𝑙𝑖 × 𝑁 𝑜𝑓 𝑎𝑙𝑘𝑎𝑙𝑖 × 3.1 = 𝑡ℎ𝑜𝑥𝑦 % 𝑤𝑒𝑖𝑔ℎ𝑡 𝑜𝑓 𝑠𝑎𝑚𝑝𝑙𝑒 (𝑔) 12 𝑚𝐿 × 0.1 × 3.1 = 0.5 𝑔 𝒎𝒆𝒕𝒉𝒐𝒙𝒚 (%) = 𝟕. 𝟒𝟒% The methoxyl content of pectin extracted from citrus was found to be 7.44%. Methoxyl content is an important factor in determining the gel formation capacity. Methoxyl content is an important factor in controlling the setting time of pectin and the ability of the pectin to form gels. C. Viscosity of the pure solvent TABLE I. Data for the determination of the viscosity of the blank solution. Pectin Solutions (heated) Pectin Solutions (not heated) Data for the determination of the viscosity of pectin solutions. Concentration (%w/v) 0.75% 0.375% 0.1875% 0.75% 0.375% 0.1875% Viscosity (cP) 7.80 4.20 3.00 6.00 3.60 2.40 Temperature (28°C) 29.2 29.5 29.5 29.0 28.7 28.6 Table 3 shows the viscosity of the pectin solution at different temperatures and concentrations. The highest viscosity of pectin solution when heated was 7.8 cP at 0.75% concentration at 29.2oC, while the lowest viscosity of pectin solution when heated was 3.0 cP at 0.1875% concentration at 29.5oC. The highest viscosity of pectin solution when not heated was 6.0 cP at 0.75% concentration at 29oC, while the lowest viscosity of pectin solution when heated was 2.4 cP at 0.1875% concentration at 28.6oC. Page 3 of 4 Torres, D.P.A.B. IV. CONCLUSION This experiment was focused on pectin extraction, isolation, and characterization. The result indicated that the best condition of the pectin was 96.15 of equivalent weight and shows that partial degradation of pectin. The viscosity of pectin was heated with 7.8 cP at 0.75% concentration at 29.2oC. V. REFERENCES [1] FAO. Nutrition meetings of the FAO, 1969, 133. [2] Happi ET, Ronkart SN, Robert C, Wathelet B, Paquot M.Characterisation of pections extracted from banana peels(Musa AAA) under different conditions using anexperimental design. Food chemistry, 2008; 108:463471. [3] Kalapathy U, Proctor A. Effect of acid extraction andalcohol precipitation conditions on the yield and purity ofsoy hull pectin. Food chemistry, 2001; 73:393396. [4] Levigne S, Ralet MC, Thibault JF. Characterisation of pectin’s extracted from fresh sugar beet under different conditions using an experimental design. Carbohydrate polymers, 2002; 49:145-153. [5] Liu Y, Shi J, Langrish TAG. Water – based extraction of pectin from flavedo and albedo orange peels. Chemicalengineering journal. 2006; 120:203-209. [6] McGready RM. Extraction of Pectin from Citrus peelspeels andersion of pectin acid. 2nd Edn. Academic pressPress York, 1996; 4:167-170. [7] Mesbahi G, Jamaliana J, Farahnaky A. A comparativestudy on functional properties of beef and citrus pectipectins systems. Food Hydrocolloids. 2005; 19:731-738. [8] Mollea C, Chiampo F, Conti R. Extraction and characterization of pectins from cocoa husks: A preliminary study. Food chemistry. 2008; 107:13531356. [9] Monsoor MA. Effect of drying methods on the functional properties of soy hull pectin. Carbohydrate polymers,2005; 61:362-367. [10] Yeoh S, Shi J, Langrish TAG. Comparisons between different techniques for water-based extraction of pectin from orange peels. Elsevier, Desalination 2008; 218:229237. Page 4 of 4 Torres, D.P.A.B.


