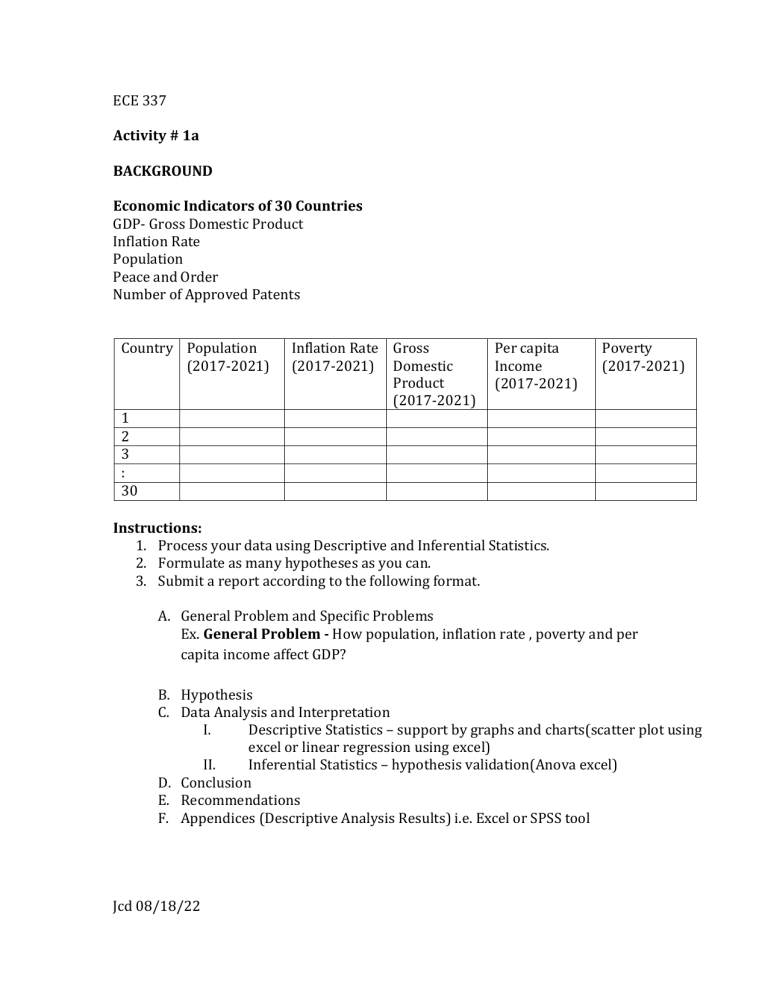
ECE 337 Activity # 1a BACKGROUND Economic Indicators of 30 Countries GDP- Gross Domestic Product Inflation Rate Population Peace and Order Number of Approved Patents Country Population (2017-2021) 1 2 3 : 30 Inflation Rate Gross (2017-2021) Domestic Product (2017-2021) Per capita Income (2017-2021) Poverty (2017-2021) Instructions: 1. Process your data using Descriptive and Inferential Statistics. 2. Formulate as many hypotheses as you can. 3. Submit a report according to the following format. A. General Problem and Specific Problems Ex. General Problem - How population, inflation rate , poverty and per capita income affect GDP? B. Hypothesis C. Data Analysis and Interpretation I. Descriptive Statistics – support by graphs and charts(scatter plot using excel or linear regression using excel) II. Inferential Statistics – hypothesis validation(Anova excel) D. Conclusion E. Recommendations F. Appendices (Descriptive Analysis Results) i.e. Excel or SPSS tool Jcd 08/18/22


