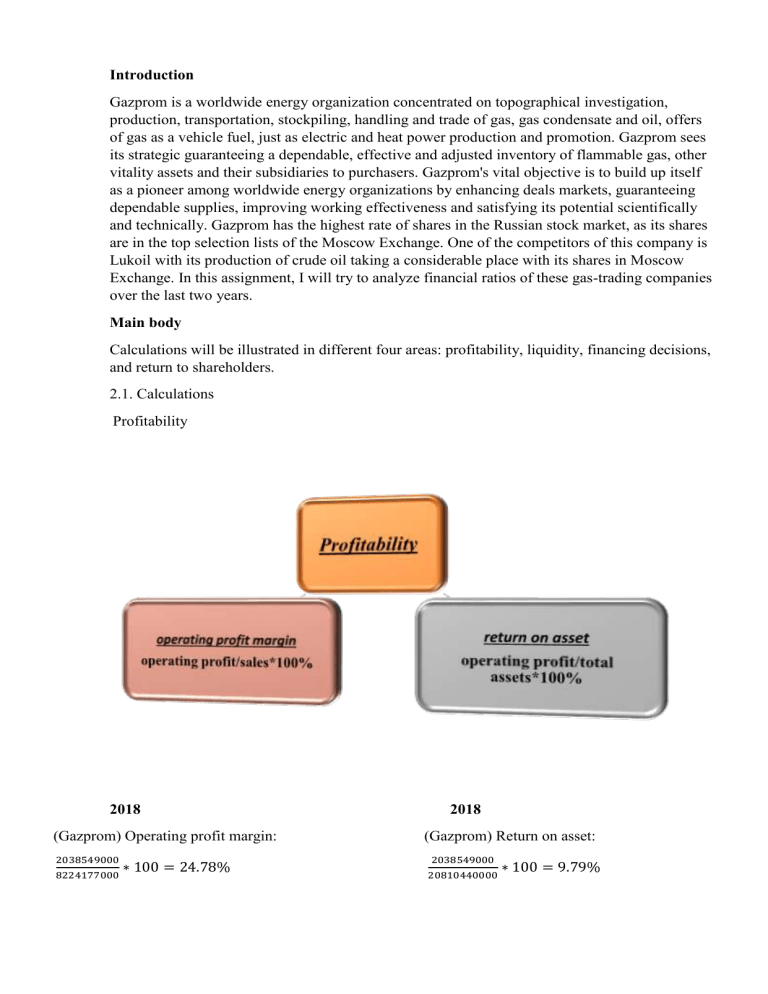
Introduction Gazprom is a worldwide energy organization concentrated on topographical investigation, production, transportation, stockpiling, handling and trade of gas, gas condensate and oil, offers of gas as a vehicle fuel, just as electric and heat power production and promotion. Gazprom sees its strategic guaranteeing a dependable, effective and adjusted inventory of flammable gas, other vitality assets and their subsidiaries to purchasers. Gazprom's vital objective is to build up itself as a pioneer among worldwide energy organizations by enhancing deals markets, guaranteeing dependable supplies, improving working effectiveness and satisfying its potential scientifically and technically. Gazprom has the highest rate of shares in the Russian stock market, as its shares are in the top selection lists of the Moscow Exchange. One of the competitors of this company is Lukoil with its production of crude oil taking a considerable place with its shares in Moscow Exchange. In this assignment, I will try to analyze financial ratios of these gas-trading companies over the last two years. Main body Calculations will be illustrated in different four areas: profitability, liquidity, financing decisions, and return to shareholders. 2.1. Calculations Profitability 2018 (Gazprom) Operating profit margin: 2038549000 ∗ 100 = 24.78% 8224177000 2018 (Gazprom) Return on asset: 2038549000 20810440000 ∗ 100 = 9.79% (Lukoil) Operating profit margin: 768721000 ∗ 100 = 9.56% 8035889000 (Lukoil) Return on asset: 768721000 ∗ 100 = 13.41% 5732382000 2017 2017 (Gazprom) Operating profit margin: 854144000 ∗ 100 = 13.04% 6546143000 (Gazprom) Return on asset: 854144000 ∗ 100 = 4.68% 18238770000 Lukoil) Operating profit margin 503811000 100 = 8.48% 5936705000 (Lukoil) Return on asset : ∗ 100 = 9.64% 5226215000 2018 (Gazprom) Current ratio: 4212230000 = 1.70 2473695000 (Lukoil) Current ratio: = 1.61 914560000 1478479000 503811000 2018 (Gazprom) Acid-test ratio: = 0.67 2473695000 1672418000 (Lukoil) Acid-test ratio: 518850000 = 0.56 914560000 2017 2017 (Gazprom) Current ratio: 3469266000 = 1,33 2589516000 (Lukoil) Current ratio: = 1.36 958847000 1308114000 2018 7034287000 20810440000 = 0.33 (Lukoil) Debt ratio: 5732382000 = 0.28 2017 18238770000 = 0.34 (Lukoil) Debt ratio: 1735816000 5226215000 (Gazprom) Times Interest Earned: 2038549000 50378000 = 40.46 (Lukoil) Times Interest Earned: 768721000 32191000 = 23.87 2017 (Gazprom) Debt ratio: 6223289000 (Lukoil) Acid-test ratio: 349951000 = 0.36 958847000 2018 (Gazprom) Debt ratio: 1658856000 (Gazprom) Acid-test ratio: 900064000 = 0.34 2589516000 = 0.33 (Gazprom) Times Interest Earned: 854144000 53332000 = 16.01 (Lukoil) Times Interest Earned: 503811000 23116000 = 21.79 2018 2018 (Gazprom) Return on Equity: 1456270000 325194000+11539811000 = 0.06 (Lukoil) Return on Equity: 619174000 1015000+3963628000 = 0.15 (Gazprom) Earning per share: 1456270000 325194000 = 4.47 (Lukoil) Earning per share: 619174000 1015000 = 610 2017 2017 (Gazprom) Return on Equity: 714302000 = 0.06 325194000+11005256000 (Gazprom) Earning per share: 714302000 = 2.19 325194000 (Lukoil) Return on Equity: (Lukoil) Earning per share: 418805000 1151000+3576158000 = 0.11 418805000 1151000 = 363 Evaluation and analyses Profitability ratios are used so that to illustrate the ability of the company to generate earnings from its operations. In other words, it is the way of calculating the profit of a company by deducting all expenses concerning to earning the income. The profitability of Gazprom and Lukoil companies has been investigated in terms of two ratios, which are operating Profit margin and Return on assets. The table below gives information on profitability of two companies, demonstrating comparison in units of two ratios: Profitability Operating profit margin Return on Assets Gazprom Lukoil 2017 2018 2017 2018 13.04% 24.78% 8.48% 9.56% 4.68% 9.79% 9.64% 13.41% It is obvious that according to 2017-year information, the ratio index of Gazprom is quite higher than Lukoil, since it comprises of 13.04% of operating profit, while Lukoil ratio was 8.48%. Moreover, paying attention to the following year, indicator of Gazprom exceeded its competitor Lukoil by consisting of 24.78% respectively. However, according to return on asset, figures of Lukoil company overreaches in both years. For instance, there is a considerable difference between two companies’ return on assets relative to Gazprom – 4.68 cents of operating profits for every 1$ of assets, compared to 13.41 cents for Lukoil company. Measurment of the liquidity of the company Liquidity is the ability of the company to have available cash when it is necessary to fulfil financial responsibilities. Liquidity ratios, that include Current Ratio and Acid test ratio, are most appropriate while implementing them in comparative form and its performance can be internal or external. Liquidity Gazprom Lukoil 2017 2018 2017 2018 Current Ratio 1.33 1.702 1.36 1.61 Acid test Ratio 0.34 0.67 0.36 0.56 According to the calculations, the liquidity of the company of Gazprom was remarkably lower than the liquidity of Lukoil, however it has changed as the time went by. As far as the current ratio is concerned in 2017, Gazprom had the liquidity of 1.33 whereas Lukoil had slightly higher rate of liquidity at 1.36. A glance at Acid test ratio reveals that Gazprom according to this test had less rate as well, at 0.34 while Lukoil was higher at 0.36. However, according to current ratio test Lukoil increased after a year for 0.25, the same can be seen in Gazprom, with increase for 0.37. Acid test ratio exposes that there was also increase in both companies, ending the period at o.67 and 0.56 accordingly. Financing decisions of companies. One of the crucial decisions made by the managers of finance is deemed to be financial decision, which assists the workers of this field by showing effectiveness and efficiency to some extent. Two sources from where the funds can be raised are included into financing decisions: usage of company’s own budget or borrowing money from other different resources. Moreover, Debt ratio and Times Interst earned is also involved. Financing decisions Debt ratio Times interest earned Gazprom 2017 0.341 16.01 Lukoil 2018 0.338 40.46 2017 0.3321 21.79 2018 0.2893 23.87 One inexclusive part of financial decisions, The Debt ratio draws comparison between organization’s overall debt and its overall assets. Proliferating debt rate paves a way for bankruptcy which means the higher the debt ratio the risk the company is acquainted with to have taken on. As far as ratio of Times Interest earned, it measures capability of the organization to satisfy its obligations in terms of debt, in case the company fails to meet its debt obligations, it is highly likely to experience bankruptcy. When it comes to analyzing the table given, these two companies, Gazprom and Lukoil’s Debt and Times interest earned ratios are put into comparison. The debt ratio of Gazprom, hovered under 0.4 in both years a bit less in 2017, at 0,341 and it can also be a true of Lukoil, however the Debt ratio of Lukoil was noticeably less at 0.28 which makes it much more successful in terms of having less debt. Regarding to Times interest earned ratio, the rate of Gazprom considerably has rosen over a year from 16.01 to 40.46. Although Lukoil also showed raise it wasn’t more than almost 24. How do shareholders profit by investing? Total shareholder return is the return of stock that investors get , the Capital Gain+ Dividents. Regardless the different way of calculation, Total Shareholders return always has the same meaning, namely total amount returned to the shareholder. Return to shareholders Return on equity Earnings per share Gazprom Lukoil 2017 0.06 2018 0.06 2017 0.11 2018 0.15 2.19 4.47 363 610 Return to shareholders ratio composes of two ratio formulas,Return on equity ratio, which is net income returned in terms of stockholders equity percentage, and Earnings per share which is considered as company’s index of profitability. Analyzing these two, from the given table it is clear that the shareholders who invest in Lukoil earn more return to their shares compared to Gazprom. It is very striking that the return to shareholders show a little if any increase from both formulas, to be more precise return to equity formula showed the same results for Gazprom in both years at 0.06 and a slight increase has been over one year in Lukoil, from 0.11 to 0.15. However, both companies experienced remarkable change, according to the calculations of earnings per share. Gazprom improved the per cents it has for shareholders from 2.19 to 4.47 whereas Lukoil showed tremendous change (almost twice as much as it was previous year), increase from 363 to 610. Overall, it is surprising that the competitor of Gazprom provides its stockholders with noticeably more return to stock. Conclusion To summarize, financial ratio analysis is necessary for potential lenders and investors, since they can rely on it while making any investing decisions. As ratios are viewed as basic quantitative investigation, another principle capacity of ratios is ability to distinguish positive and negative financial trends. It may also give the best approach to contrast existing business with another organization of comparative status, namely a contender. Regarding to ratio analyzes of the most recent consecutive 2 years of Gazprom Company and Lukoil Corporation, it was apparent that these two companies can be considered as worthy contender to each other, in spite of the fact that there were fluctuations, where one of the companies overreached another and the contrary. Taking everything into account, due to ratio analysis, and financial performance of the two previously mentioned companies have been investigated in proper way.


