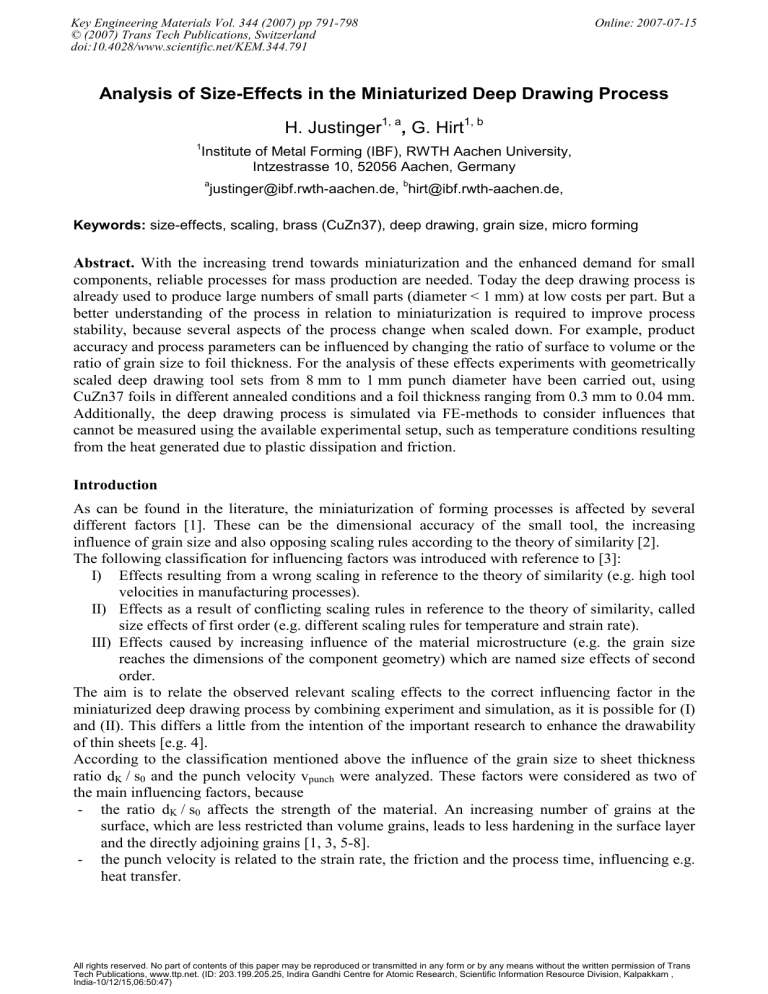
Key Engineering Materials Vol. 344 (2007) pp 791-798 © (2007) Trans Tech Publications, Switzerland doi:10.4028/www.scientific.net/KEM.344.791 Online: 2007-07-15 Analysis of Size-Effects in the Miniaturized Deep Drawing Process H. Justinger1, a, G. Hirt1, b 1 Institute of Metal Forming (IBF), RWTH Aachen University, Intzestrasse 10, 52056 Aachen, Germany a b justinger@ibf.rwth-aachen.de, hirt@ibf.rwth-aachen.de, Keywords: size-effects, scaling, brass (CuZn37), deep drawing, grain size, micro forming Abstract. With the increasing trend towards miniaturization and the enhanced demand for small components, reliable processes for mass production are needed. Today the deep drawing process is already used to produce large numbers of small parts (diameter < 1 mm) at low costs per part. But a better understanding of the process in relation to miniaturization is required to improve process stability, because several aspects of the process change when scaled down. For example, product accuracy and process parameters can be influenced by changing the ratio of surface to volume or the ratio of grain size to foil thickness. For the analysis of these effects experiments with geometrically scaled deep drawing tool sets from 8 mm to 1 mm punch diameter have been carried out, using CuZn37 foils in different annealed conditions and a foil thickness ranging from 0.3 mm to 0.04 mm. Additionally, the deep drawing process is simulated via FE-methods to consider influences that cannot be measured using the available experimental setup, such as temperature conditions resulting from the heat generated due to plastic dissipation and friction. Introduction As can be found in the literature, the miniaturization of forming processes is affected by several different factors [1]. These can be the dimensional accuracy of the small tool, the increasing influence of grain size and also opposing scaling rules according to the theory of similarity [2]. The following classification for influencing factors was introduced with reference to [3]: I) Effects resulting from a wrong scaling in reference to the theory of similarity (e.g. high tool velocities in manufacturing processes). II) Effects as a result of conflicting scaling rules in reference to the theory of similarity, called size effects of first order (e.g. different scaling rules for temperature and strain rate). III) Effects caused by increasing influence of the material microstructure (e.g. the grain size reaches the dimensions of the component geometry) which are named size effects of second order. The aim is to relate the observed relevant scaling effects to the correct influencing factor in the miniaturized deep drawing process by combining experiment and simulation, as it is possible for (I) and (II). This differs a little from the intention of the important research to enhance the drawability of thin sheets [e.g. 4]. According to the classification mentioned above the influence of the grain size to sheet thickness ratio dK / s0 and the punch velocity vpunch were analyzed. These factors were considered as two of the main influencing factors, because - the ratio dK / s0 affects the strength of the material. An increasing number of grains at the surface, which are less restricted than volume grains, leads to less hardening in the surface layer and the directly adjoining grains [1, 3, 5-8]. - the punch velocity is related to the strain rate, the friction and the process time, influencing e.g. heat transfer. All rights reserved. No part of contents of this paper may be reproduced or transmitted in any form or by any means without the written permission of Trans Tech Publications, www.ttp.net. (ID: 203.199.205.25, Indira Gandhi Centre for Atomic Research, Scientific Information Resource Division, Kalpakkam , India-10/12/15,06:50:47) 792 Sheet Metal 2007 Experimental Setup To analyze how the miniaturized forming process is affected by these factors the experiments were performed by a deep drawing tool with exchangeable tool sets. Thus, the process can be scaled down from 8 mm to 1 mm punch diameter with the geometries given in Table 1 [9] and related to the scaling factor λ. The punch velocities ranging from 0.01 mm/s to 100 mm/s, corresponding to the range from the quasi static state to the lower bound of manufacturing process velocities. Table 1. Scaling factors and tool set geometry 1/1 1/2 Scaling factor λ Punch diameter dpunch [mm] 8.00 4.00 Die diameter D1 [mm] 8.60 4.30 Blank diameter [mm] 16.00 8.00 Foil thickness [mm] 0.30 0.15 Blank holder gap ~1.3 s0 1/4 2.00 2.16 4.00 0.08 1/8 1.00 1.08 2.00 0.04 Brass foils (CuZn37) in initial (as-delivered) and annealed conditions were used for the experiments. The annealing temperatures and time periods have been varied to achieve different grain sized material and different grain size to sheet thickness ratios dK / s0, respectively (Table 2). Table 2. Annealing procedure, grain size and grain size to sheet thickness ratios dK / s0 for all foils Material Condition (Temperature, Time) Grain Size [µm] d K / s0 Initial (as-delivered) 5.4 - 8.2 0.027 - 0.036 Annealed 300° C 3 h 2.7 - 5.4 0.018 - 0.067 Annealed 450 °C 3 h 15.9 - 26.1 0.106 - 0.087 Annealed 600 °C 0.5 h 15.9 - 56.4 0.188 - 0.397 Annealed 600 °C 3 h 31.8 - 84.5 0.269 - 0.795 Annealed 600 °C 6 h 31.1 - 92.9 0.294 - 0.778 punch diameter Ø 8 mm Ø 4 mm Ø 2 mm Ø 1 mm 40 µm 80 µm 150 µm thickness 300 µm scaled punch force Punch Force Measurement. With the change of the wall thickness (the increase in the upper part of the side wall) due to the process in addition with the anisotropy of the sheet, a slight ironing occurs in approximately 1/3 of the wall. This changes the commonly known punch forcedisplacement curve with one maximum into a curve with two maxima: a deep drawing maximum Fmax,D followed by an ironing maximum Fmax,I (Fig. 2). These two maxima are affected in different ways by the influencing factors in the experiments, so that the combined process of deep drawing and ironing is very helpful for the identification of relevant factors. 3.5 3.0 2.5 2.0 1.5 1.0 0.5 0 Fmax,D 0 Fmax,I 0.5 1.0 norm. punch displacement Fig. 1. Set of cups from CuZn37 deep drawn from as-delivered material (left side) Fig. 2. Schematic punch force displacement curve with the two maxima (right side) Key Engineering Materials Vol. 344 793 For all curves the punch force Fpunch has been scaled by the scaling factor λ (Eq. 1, Eq. 2) and the punch displacement h (Eq. 3) has been normalized to hn by the punch diameter dpunch to achieve a better comparability between different tool sets. λ = dpunch / 8 mm (1) Fscaled = Fpunch / λ2 (2) hn = h / dpunch (3) Experimental Results scaled deep drawing maximum [kN] Influence of Grain Size on the Punch Force. Fig. 3 shows the scaled deep drawing maxima depending on punch velocity and the aforementioned ratios of grain size to sheet thickness dK / s0. In addition to the punch force maxima, every range of the ratio dK / s0 of every scaling factor is inserted into the lower part of the diagram. The diagram is obtained by considering all maxima as only depending on the ratio dK / s0 and independent from the scaling factor of all experiments. It can be seen that in the range of the ratio dK / s0 from 0.05 to 0.2 a change in the punch force maxima towards smaller values occurs, which is maintained almost on the same level for all higher ratio dK / s0. 4.0 3.5 100 mm/s 3.0 1 mm/s 2.5 0.01 mm/s 2.0 1.5 λ = 1/1 (0.3 mm) λ = 1/2 (0.15 mm) λ = 1/4 (0.08 mm) 1.0 0.5 0.0 0.0 λ = 1/8 (0.04 mm) 0.2 0.4 0.6 0.8 Grain size / foil thickness 1.0 Fig. 3. Scaled deep drawing maxima for different punch velocities depending on the grain size to foil thickness ratio dK / s0 As the flow stress is the dominant factor for the punch force [10] a first explanation for the curve progression is presented as follows. Until the ratio dK / s0 increases to ~ 0.05 (20 grains over foil thickness) the foils can be regarded as “bulk” material with a yield strength related to the Hall-Petch relation. With an increasing ratio up to ~ 0.2 (5 grains over foil thickness) the strength of a metal reduces for constant grain sizes and decreasing number of grains over the cross section if a critical material dependant value is reached (Table 2), as shown in [5-8]. In the third part of the curve with less than 5 grains over foil thickness (especially if single grains over the thickness appear as seen in the experiments) the material approaches the same flow stress independent of the grain size, according to the work of Armstrong [11] and Miyazaki et. al. [5]. In the work of [12] a number of 50 grains over the cross-section is given as a critical value influencing the flow stress of a metal. 794 Sheet Metal 2007 Source [5-7] Table 2. Critical grain number depending on material Material Grain size [µm] Critical grain number Cu 65 5–7 Cu-13 at% Al [8] 40 Sn and Sn alloys 10 – 15 ~ 20 scaled punch force [kN] Influence of Punch Velocity on the Punch Force. As described in former work [9], it has been observed for the as-delivered material, that for the two biggest scaling factors the deep drawing maxima decreased with increasing punch velocity (Fig. 4). The deep drawing maxima for the annealed material (here 600 °C for 3 h) in contrast, remain the same for all punch velocities. This was found for two different batches. 4.0 initial 3.5 3.0 λ = 1/1 (Ø 8 mm) λ = 1/2 (Ø 4 mm) 2.5 annealed 2.0 0.01 0.1 1 10 100 punch velocity [mm/s] Fig 4. Deep drawing maximum depending on punch velocity and scaling factor λ A first explanation was that the punch force decrease is related to a decreasing coefficient of friction with increasing punch velocity according to the STRIBECK diagram [13]. However, this effect was only observed for the biggest scaling factors and for the as-delivered material, which is more sensitive to thermal influences. A second explanation relates the effect to the increasing surface to volume ratio O/V with decreasing scaling factors λ. The larger specific surface of the smaller cups enables a faster transfer of the heat generated by plastic dissipation and friction, thereby decreasing the effect on material properties as well as e.g. the viscosity of lubricant at the blank surface. Simulation For the analysis of the influence due to the punch velocity, a thermal-mechanical coupled FE-model [9] was augmented by flow stress curves obtained by tensile tests in temperature steps of 100 °C from room temperature (RT) to 300 °C. Material Data. Tensile tests were carried out with the as-delivered material of 0.3 mm thickness to obtain the needed material data in the temperature range from RT to 300 °C. The specimens (DIN 50125-H 12,5 x 50) were punched in the rolling direction and tested with a cross head velocity of 1 mm/min ( ϕ& ≈ 0.000118 s-1). The temperature was measured with a thermo-couple on the specimen surface while a combined heating and hold time of 30 min ensured through heating of the sample. The averaged strain-stress data is shown Fig. 5. A temperature of just 100 °C reduced the strength ~ 3 %. A further temperature increase up to 200 °C induced a loss of strength of ~ 10 %. At a temperature of 300 °C the material’s strength is only half of the room temperature strength and indication of dynamic work softening can be seen. Identical specimens were annealed according the heating and holding time. After cooling down to RT they were tested to proof the influence on the micro structure. All specimens reached the Key Engineering Materials Vol. 344 795 strength of the initial material with the exception of the 300 °C specimens, which showed a ~ 5 % lower strength (Fig. 5). A cross head velocity of 100 mm/min ( ϕ& ≈ 0.0118 s-1) tested at RT and with as-delivered material did not affect the material properties. 0.6 100°C 0.4 200°C 0.3 0.2 0.1 stress [kN/mm²] 0.5 stress [kN/mm²] 0.6 RT 0.5 RT 100°C 200°C 0.4 0.3 0.2 300°C 0.1 300°C 0 0 0 10 20 strain [%] 30 0 10 strain [%] 20 Fig. 5. Tensile tests at elevated temperatures with as-delivered material (left side) and with annealed specimens at room temperature RT (right side) The material data was extrapolated by the common LUDWIK Law (Eq. 4) to achieve the temperature dependant flow stress curves for simulation. kf = kf,0 + c * ϕn (4) Numerical Results. A thermal-mechanical FE-simulation was carried out as axisymmetric 2d implicit simulation with ABAQUS/Standard using data shown in Table 3 and considering heat conduction in the tools. The geometry and punch velocity were derived from the experiments as described above. Since it was not possible to determine the heat transfer coefficient α for the deep drawing tool, it was taken to be within the range of α = 200 W/m2K to α = 20000 W/m2K as lower and upper bound. Table 3. Material data used for FE-simulation Heat conduction [W/mK] [14]: 120 (23 °C) and 160 (200 °C) Young’s Modulus [kN/mm²] [15]: 111 (23 °C) and 98 (300 °C) Heat transfer coefficient [W/m2K]: lower bound: 200 and upper bound: 20000 Specific heat [J/kgK] [14]: 390 Thermal expansion [1/K]: 18.5 * 10-06 Density [g/cm³]: 8.45 Poison ratio: 0.37 Initial temperature [°C]: 23 Flow curves: as described above The simulation results showed that the cup temperature did not change for a punch velocity = 0.01 mm/s independent of scaling factor and heat transfer coefficient. The maximum temperatures of the biggest cups with a diameter of 8 mm (λ = 1/1) were ~ 130 °C and ~ 210 °C for α = 20000 W/m2K and α = 200 W/m2K respectively, when the punch velocity was increased to 100 mm/s. For the same punch velocity the maximum temperature of the cups with diameter of 2 mm (λ = 1/4) was ~ 90 °C (α = 20000 W/m2K) and ~ 160 °C (α = 200 W/m2K) respectively. The highest temperature was present in the upper side wall due to the fact that this zone experiences the highest strains (Fig 6). 796 Sheet Metal 2007 210 temperature [°C] 230 160 130 90 195 160 140 120 100 80 80 85 160 65 125 90 50 20 Scaling factor: 30 60 1/1 45 50 35 30 1/4 60 1/1 1/4 200 W/m²K 200 W/m²K 20000 W/m²K 20000 W/m²K α: Fig. 6. Temperature distribution in the cup for punch velocity 100 mm/s, different heat transfer coefficients α and different scaling factors λ The punch force-displacement curves obtained in simulation are shown in Fig. 7 and Fig. 8 in comparison to the forces measured in the experiments. Although many simulation input parameters are taken from the literature, the simulation results show good agreement with the experiments. As expected from the heat distribution showing the maximum temperatures in the upper side wall, the ironing maximum (2nd max) is more affected by the change in punch velocity than the deep drawing maximum (1st max). If the low heat transfer coefficient α is taken the second maximum is reduced significantly for high punch velocities because the generated heat cannot be transferred fast enough into the tool set. The heating of the material causes softening, resulting in a reduced punch force. For the upper bound of the heat transfer coefficient α, a faster heat exchange is enabled and as a consequence the ironing maxima of the punch forces move towards the values without thermal effects. This is equivalent to slow punch velocity (vpunch = 0.01 mm/s). This can be seen for both scaling factors in Fig. 7 and Fig. 8 on the left side. But the differences between the punch forces with and without thermal influence are smaller for the small scaling factor, due to the larger ratio of surface to volume O/V, which leads to a lower maximum temperature and a lower punch force, respectively, than for the bigger cups. Conclusions and Outlook Two different size effects were observed in the analysis of the micro deep drawing process. The maximum punch forces were independent of the scaling factor but were dependent on the ratio dK / s0 (Fig. 3), which is a scaling effect of second order. Furthermore, the punch force for the asdelivered material and scaling factor 1/1 behaved differently from the annealed material and for the smaller scaling factors. The maximum punch forces of the bigger cups decreases with increasing velocity, while the punch forces of the smaller do not. A thermal-coupled FE-simulation showed that this could be partially related to thermal influences caused by heat generated from plastic dissipation and friction in combination with the differences of the surface to volume ratio for the different scaling factors (Fig. 7 and Fig. 8). It is classified as a size effect of first order. Present work focuses on the modeling of micro deep drawing using a 3d thermal-coupled simulation. Considering the anisotropy of the foils might improve the simulation results due to the higher strains expected in the upper side wall of the cup and increased softening due to higher temperature. In addition, the influence of friction has to be considered in greater detail. As a first step, the surface roughness will be measured. Key Engineering Materials Vol. 344 4.5 100 mm/s 20000 W/m²K 100 mm/s 200 W/m²K 0.01 mm/s 20000 W/m²K 4 3.5 3 2.5 scaled punch force [kN] scaled punch force [kN] 4.5 797 0.01 mm/s 100 mm/s 4 3.5 3 2.5 2 2 0.2 0.4 0.6 0.8 1 norm. punch displacement 0.2 0.4 0.6 0.8 1 norm. punch displacement Fig. 7. Punch force displacement curves for scaling factor 1/1 depending on punch velocity and heat transfer coefficients α from FE-simulation (left side) and from experiment (right side) 4.5 100 mm/s 20000 W/m²K 100 mm/s 200 W/m²K 0.01 mm/s 20000 W/m²K 4 3.5 3 2.5 2 scaled punch force [kN] scaled. punch force [kN] 4.5 0.01 mm/s 100 mm/s 4 3.5 3 2.5 2 0.2 0.4 0.6 0.8 1 norm. punch displacement 0.2 0.4 0.6 0.8 1 norm. punch displacement Fig. 8. Punch force displacement curves for scaling factor 1/4 depending on punch velocity and heat transfer coefficients α from FE-simulations (left side) and from experiments (right side) Acknowledgement The authors gratefully acknowledge the support from the “Deutsche Forschungsgemeinschaft” (German Research Foundation) within the priority program SPP-1138 “Modeling of scaling effects on manufacturing processes”. References [1] F. Vollertsen, Z. Hu, H. Schulze Niehoff, C. Theiler: State of the art in micro and investigations into micro deep drawing, Journal of Materials Processing Technology 151, 2004, S. 70-79 798 Sheet Metal 2007 [2] Pawelski, O.: Ähnlichkeitstheorie in der Umformtechnik, Plastomechanik und Werkstoffkunde, Berlin, Springer, 1993, ISBN 3-50-56682-1, 1993 [3] Geiger, M., Vollertsen, F., Kals, R.: Fundamentals on the Manufacturing of Sheet Metal Microparts, Annals of the CIRP, Vol. 45/1/1996, pp. 277-282 [4] Y. Saotome, K. Yasuda, H. Kaga: Microdeep drawability of very thin sheet steels, Journal of Materials Processing Technology, 113, 2001, 641-647 [5] S. Miyazaki, K. Shibata, H. Fujita: Effect of Specimen Thickness on mechanical Properties of polycrystalline Aggregates with various Grain Sizes, Acta Metallurgica, Vol. 27, pp. 855-862, 1978 [6] S. Miyazaki, H. Fujita, H. Hiraoka: Effect of Specimen Size on the Flow Stress of Rod Specimens of polycrystalline Cu-Al Alloy, Scripta Metallurgica, Vol. 13, pp 447-449, 1979 [7] S. Miyazaki, H. Fujita: Effects of Grain Size and Specimen Thickness on Mechanical Properties of Polycrystalline Copper and Copper-Aluminum Alloy, Trans. JIM, Vol. 19, 1978 [8] T. Pell-Walpole: The Effekt of Grain-Size on the Tensile Strength of Tin and Tin Alloys, J. Inst. Metals,Vol. 69, 1943, pp. 131-146 [9] Justinger, H., Witulski, N., Hirt, G.: Experimental and Numerical Investigation of Miniaturisation in Deep Drawing, Proc. of the 10th International Conference on Metal Forming, 2004, Grips media [10] E. Siebel: Der Niederhalterdruck beim Tiefziehen, Stahl und Eisen 74 (1954),Nr.: 3 [11] W. Armstrong: On Size Effects in polycrystal Plasticity, J. Mech. Phys. Solids, Vol. 9, 1961, pp. 196-199 [12] M. Henning, H. Vehoff: Größeneffekte im Zugversuch aufgrund plastischer Anisotropie, Prozessskalierung, Strahltechnik Band 27, BIAS Verlag, 2005, ISBN: 3-933762-17-0, S. 137146 [13] Kopp, R., Wiegels, H.: Einführung in die Umformtechnik, 2. korrigierte Auflage, Aachen, Verlag Mainz, 1999, ISBN 3-86073-821-5 [14] Wieland-Werke AG: Wieland-Kupferwerkstoffe – Herstellung, Verarbeitung, 6. Auflage, Ulm, Süddeutsche Verlagsgesellschaft, 1999 Eigenschaften und [15] Dies, K.: Kupfer und Kupferlegierungen in der Technik, Springer-Verlag, Berlin/ Heidelberg/ New York, 1967 Sheet Metal 2007 10.4028/www.scientific.net/KEM.344 Analysis of Size-Effects in the Miniaturized Deep Drawing Process 10.4028/www.scientific.net/KEM.344.791


