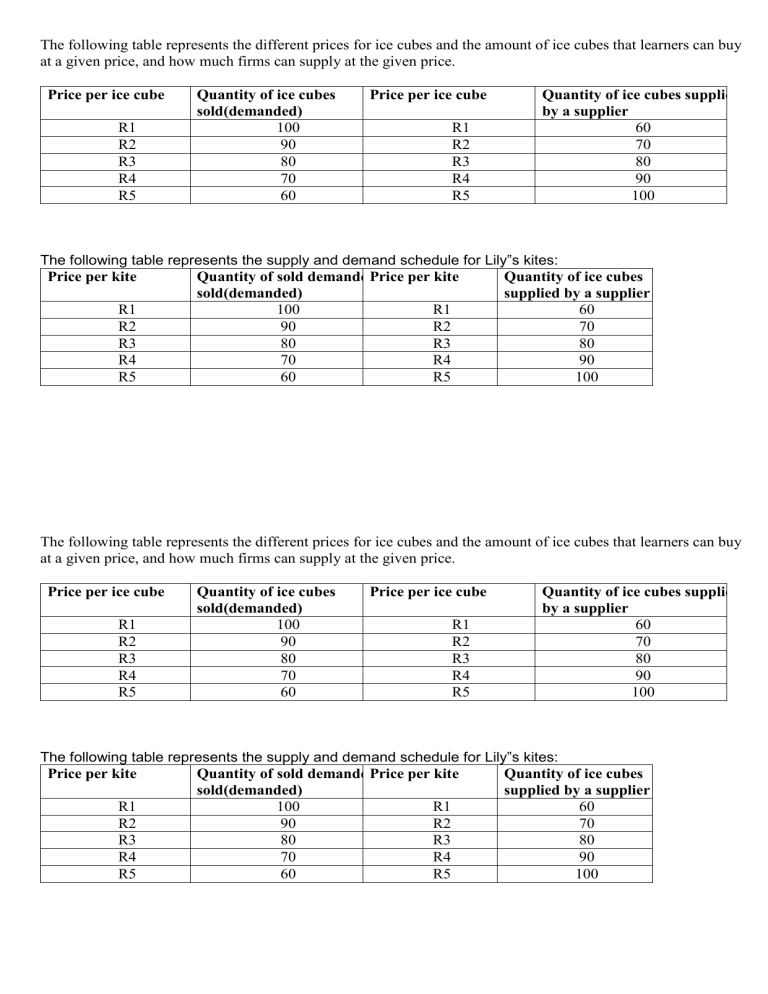
The following table represents the different prices for ice cubes and the amount of ice cubes that learners can buy at a given price, and how much firms can supply at the given price. Price per ice cube R1 R2 R3 R4 R5 Quantity of ice cubes sold(demanded) 100 90 80 70 60 Price per ice cube R1 R2 R3 R4 R5 Quantity of ice cubes supplied by a supplier 60 70 80 90 100 The following table represents the supply and demand schedule for Lily‟s kites: Price per kite Quantity of sold demandedPrice per kite Quantity of ice cubes sold(demanded) supplied by a supplier R1 100 R1 60 R2 90 R2 70 R3 80 R3 80 R4 70 R4 90 R5 60 R5 100 The following table represents the different prices for ice cubes and the amount of ice cubes that learners can buy at a given price, and how much firms can supply at the given price. Price per ice cube R1 R2 R3 R4 R5 Quantity of ice cubes sold(demanded) 100 90 80 70 60 Price per ice cube R1 R2 R3 R4 R5 Quantity of ice cubes supplied by a supplier 60 70 80 90 100 The following table represents the supply and demand schedule for Lily‟s kites: Price per kite Quantity of sold demandedPrice per kite Quantity of ice cubes sold(demanded) supplied by a supplier R1 100 R1 60 R2 90 R2 70 R3 80 R3 80 R4 70 R4 90 R5 60 R5 100

