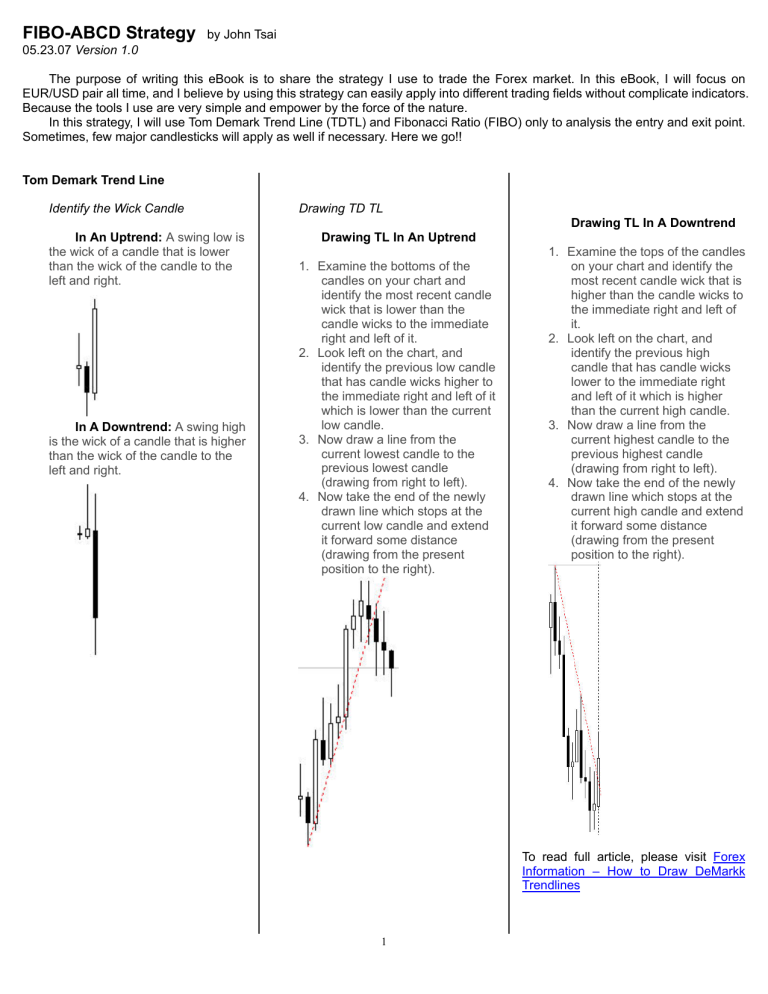
FIBO-ABCD Strategy by John Tsai 05.23.07 Version 1.0 The purpose of writing this eBook is to share the strategy I use to trade the Forex market. In this eBook, I will focus on EUR/USD pair all time, and I believe by using this strategy can easily apply into different trading fields without complicate indicators. Because the tools I use are very simple and empower by the force of the nature. In this strategy, I will use Tom Demark Trend Line (TDTL) and Fibonacci Ratio (FIBO) only to analysis the entry and exit point. Sometimes, few major candlesticks will apply as well if necessary. Here we go!! Tom Demark Trend Line Identify the Wick Candle Drawing TD TL Drawing TL In A Downtrend In An Uptrend: A swing low is the wick of a candle that is lower than the wick of the candle to the left and right. In A Downtrend: A swing high is the wick of a candle that is higher than the wick of the candle to the left and right. Drawing TL In An Uptrend 1. Examine the bottoms of the candles on your chart and identify the most recent candle wick that is lower than the candle wicks to the immediate right and left of it. 2. Look left on the chart, and identify the previous low candle that has candle wicks higher to the immediate right and left of it which is lower than the current low candle. 3. Now draw a line from the current lowest candle to the previous lowest candle (drawing from right to left). 4. Now take the end of the newly drawn line which stops at the current low candle and extend it forward some distance (drawing from the present position to the right). 1. Examine the tops of the candles on your chart and identify the most recent candle wick that is higher than the candle wicks to the immediate right and left of it. 2. Look left on the chart, and identify the previous high candle that has candle wicks lower to the immediate right and left of it which is higher than the current high candle. 3. Now draw a line from the current highest candle to the previous highest candle (drawing from right to left). 4. Now take the end of the newly drawn line which stops at the current high candle and extend it forward some distance (drawing from the present position to the right). To read full article, please visit Forex Information – How to Draw DeMarkk Trendlines 1 Fibonacci Ratio Candlesticks In this strategy, the Fibonacci ratios I will use are: 23.6 / 38.2 / 50.0 / 61.8 / 78.6 / 127.2 / 161.8 Candlesticks are not main focus in this strategy, but I only use them for the confirmation of reversal point. Here is the concept of ABCD strategy: Here are major Candlesticks I use: To find out more Candlestick info, please visit: http://www.daytradersbulletin.com/html/cs1.html 2 FIBO – ABCD Strategy Step by Step Instruction In the strategy, I check the setup once a day and the time is 00:00GMT. In the following step by step instruction, I will use the day at 01/01/2006. I will assume when the day we open the chart, those are the info I saw at 01/01/2006 00:00GMT. Step 1 Identify the trend in Monthly Chart: I use the same MN chart to draw the bigger Fib Ratio from the most significant swing low back at Sep, 2000 to the top. I see Fib Ratio of 38.2 clusters with 127.2 we just draw. But, I still keep open mind to see if price hit either 38.2 or 161.8 before violate the TL. I realized this is a downtrend, and TP 127.2 fulfilled, but at this point, I can’t say it the end of trend or not. 3 Step 2 Step 3 Identify the trend in Weekly Chart: Identify the trend in Day Chart: Aha!!!! I see the pt C from at Fib 61.8, and the previous price high become the support line at same line. Also, uptrend TL holds the price when it consolidate. This is a good entry we see at 01/02/2006 00:00GMT. As the result, I take the entry. O 11812 Here we goes, I see the downtrend TL been violated. There is a big opportunity to see trend reverse. Plus we see the hammer at the end of trend. (7th candle from the right) But for my safety, I want to see a swing low form the pt C before I take any action. 4 SL 11640 TP 12132 Tip and Note Step 4 I complete go through of the step by step process of FIBO –ABCD strategy, but there are couple points I want to point out. Patient, Patient, more Patient!! 1. I haven’t test enough on the ratio of win or lose percentage. If you want to use this strategy, please trade carefully. I will not responsible for your risk. 2. If setup didn’t recognize in day chart, you can keep going to H4 to find the setup if necessary, but I will not suggest the setup goes lower then H4. Because this strategy is design to analysis once a day (00:00GMT) and place the trade right away without waiting in hassle. 3. Regarding to the TL, use Day Chart as the bottom line information. If the time frame that lower then the Day chart’s TL been violated, I will not consider it due to the strategy designing purpose. 4. I need people to help me to do more back test in all type of currency pairs. If you comes out the result of it, please simply post on the thread. I believe the nature is following in a type of unseen power. Therefore, this strategy can easily apply into all type of trading field without complicate indicators. If you have any comment, please feel free to email me or chat with me. Email / MSN: hungchih@hotmail.com Wish your financial success The profit into the pocket few days after and the strategy FIBO resume again to our next entry opportunity. THE END 5


