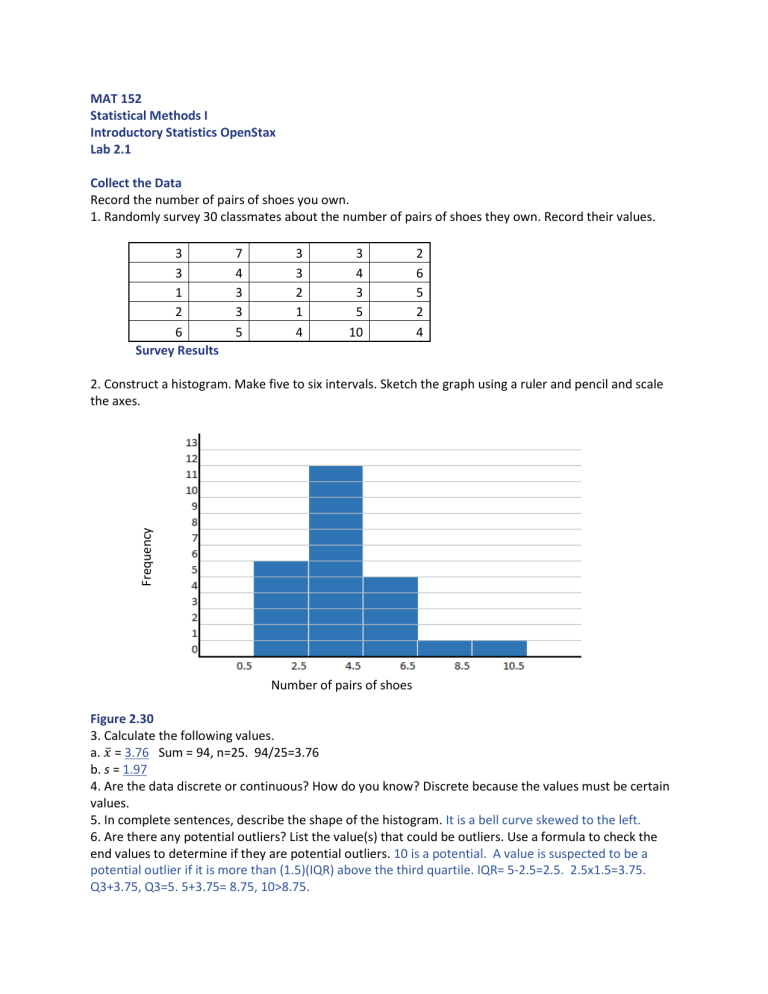
MAT 152 Statistical Methods I Introductory Statistics OpenStax Lab 2.1 Collect the Data Record the number of pairs of shoes you own. 1. Randomly survey 30 classmates about the number of pairs of shoes they own. Record their values. 3 3 1 2 6 Survey Results 7 4 3 3 5 3 3 2 1 4 3 4 3 5 10 2 6 5 2 4 Frequency 2. Construct a histogram. Make five to six intervals. Sketch the graph using a ruler and pencil and scale the axes. Number of pairs of shoes Figure 2.30 3. Calculate the following values. a. 𝑥̅ = 3.76 Sum = 94, n=25. 94/25=3.76 b. s = 1.97 4. Are the data discrete or continuous? How do you know? Discrete because the values must be certain values. 5. In complete sentences, describe the shape of the histogram. It is a bell curve skewed to the left. 6. Are there any potential outliers? List the value(s) that could be outliers. Use a formula to check the end values to determine if they are potential outliers. 10 is a potential. A value is suspected to be a potential outlier if it is more than (1.5)(IQR) above the third quartile. IQR= 5-2.5=2.5. 2.5x1.5=3.75. Q3+3.75, Q3=5. 5+3.75= 8.75, 10>8.75. Analyze the Data 1. Determine the following values. a. Min = 1 b. M = 3 c. Max = 10 d. Q1 = 2.5 e. Q3 = 5 f. IQR = Q3-Q1 = 2.5 2. Construct a box plot of data 3. What does the shape of the box plot imply about the concentration of data? Use complete sentences. The majority of the data is below the median. The middle 50% are concentrated around the mean. 4. Using the box plot, how can you determine if there are potential outliers? The distance of the right whisker is very long and with the majority of the numbers being closer to the mean and median it is likely there are outliers. Just looking at the distance from Q3 it’s pretty obvious. 5. How does the standard deviation help you to determine concentration of the data and whether or not there are potential outliers? The greater the average distance from the median, the more spread the numbers have. 6. What does the IQR represent in this problem? About 50% of the people have 2.5 to 5 pairs of shoes. 7. Show your work to find the value that is 1.5 standard deviations: S is already calculated at 1.97. 1.5 x 1.97 = 2.96. The mean = sum/n = 94/25 = 3.76 a. above the mean. 3.76 + 2.96 = 6.72 b. below the mean. 3.76 – 2.96 = 0.8
