IRJET- Titanic Survival Analysis using Logistic Regression
advertisement

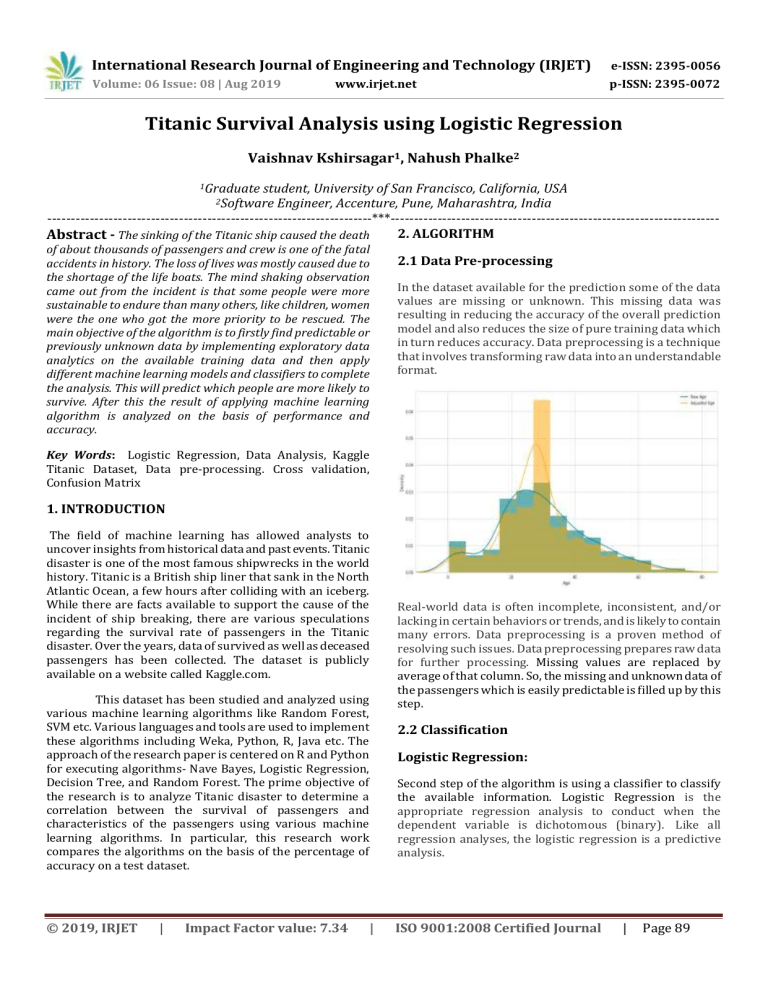
International Research Journal of Engineering and Technology (IRJET) e-ISSN: 2395-0056 Volume: 06 Issue: 08 | Aug 2019 p-ISSN: 2395-0072 www.irjet.net Titanic Survival Analysis using Logistic Regression Vaishnav Kshirsagar1, Nahush Phalke2 1Graduate student, University of San Francisco, California, USA Engineer, Accenture, Pune, Maharashtra, India ---------------------------------------------------------------------***---------------------------------------------------------------------2. ALGORITHM Abstract - The sinking of the Titanic ship caused the death 2Software of about thousands of passengers and crew is one of the fatal accidents in history. The loss of lives was mostly caused due to the shortage of the life boats. The mind shaking observation came out from the incident is that some people were more sustainable to endure than many others, like children, women were the one who got the more priority to be rescued. The main objective of the algorithm is to firstly find predictable or previously unknown data by implementing exploratory data analytics on the available training data and then apply different machine learning models and classifiers to complete the analysis. This will predict which people are more likely to survive. After this the result of applying machine learning algorithm is analyzed on the basis of performance and accuracy. 2.1 Data Pre-processing In the dataset available for the prediction some of the data values are missing or unknown. This missing data was resulting in reducing the accuracy of the overall prediction model and also reduces the size of pure training data which in turn reduces accuracy. Data preprocessing is a technique that involves transforming raw data into an understandable format. Key Words: Logistic Regression, Data Analysis, Kaggle Titanic Dataset, Data pre-processing. Cross validation, Confusion Matrix 1. INTRODUCTION The field of machine learning has allowed analysts to uncover insights from historical data and past events. Titanic disaster is one of the most famous shipwrecks in the world history. Titanic is a British ship liner that sank in the North Atlantic Ocean, a few hours after colliding with an iceberg. While there are facts available to support the cause of the incident of ship breaking, there are various speculations regarding the survival rate of passengers in the Titanic disaster. Over the years, data of survived as well as deceased passengers has been collected. The dataset is publicly available on a website called Kaggle.com. This dataset has been studied and analyzed using various machine learning algorithms like Random Forest, SVM etc. Various languages and tools are used to implement these algorithms including Weka, Python, R, Java etc. The approach of the research paper is centered on R and Python for executing algorithms- Nave Bayes, Logistic Regression, Decision Tree, and Random Forest. The prime objective of the research is to analyze Titanic disaster to determine a correlation between the survival of passengers and characteristics of the passengers using various machine learning algorithms. In particular, this research work compares the algorithms on the basis of the percentage of accuracy on a test dataset. © 2019, IRJET | Impact Factor value: 7.34 | Real-world data is often incomplete, inconsistent, and/or lacking in certain behaviors or trends, and is likely to contain many errors. Data preprocessing is a proven method of resolving such issues. Data preprocessing prepares raw data for further processing. Missing values are replaced by average of that column. So, the missing and unknown data of the passengers which is easily predictable is filled up by this step. 2.2 Classification Logistic Regression: Second step of the algorithm is using a classifier to classify the available information. Logistic Regression is the appropriate regression analysis to conduct when the dependent variable is dichotomous (binary). Like all regression analyses, the logistic regression is a predictive analysis. ISO 9001:2008 Certified Journal | Page 89 International Research Journal of Engineering and Technology (IRJET) e-ISSN: 2395-0056 Volume: 06 Issue: 08 | Aug 2019 p-ISSN: 2395-0072 www.irjet.net Logistic regression is used to describe data and to explain the relationship between one dependent binary variable and one or more nominal, ordinal, interval or ratio-level independent variables. It uses a method of using he regression line between dependent and independent variable to predict the value of the dependent variable. 2.3 Cross validation Dataset is divided into two main parts namely Train and Test data. Training data will be considered for the training of the machine. Test data will be used for validating the machine. Cross validation technique used here is K-Fold. The method has only one parameter called k that refers to the number of groups into which a given data sample is to be split. As such, the method is also called k-fold crossvalidation. When a particular value for k is chosen, it may be used in place of k in the reference to the model, such as k=10 becoming 10-fold cross-validation. 2.4 Analysis of confusion matrix Confusion matrix is used to show the performance of the algorithm. Accuracy of the model can be predicted using the confusion matrix. It is a plotting of relation between real and predicted outputs. It allows us to check the accuracy and performance of the algorithm. In this case we are using two attributes at a time for the confusion matrix plotting. Test case data is used to build the confusion matrix. The values shown in the confusion matrix are the probability of survival of the individual considering only those parameters. As shown in fig [2] the cell on first column and is of age and the 7th row is sex_male i.e. the probability of surviving the individual is depending on the age and the gender as if he is male is 0.081. As it is positive there is a possibility that the person with this attribute survives. © 2019, IRJET | Impact Factor value: 7.34 | 3. RESULTS The logistic regression gives the accuracy of 95% which is based on the confusion matrix. The parameters used here are accuracy and false discovery rate. Accuracy is a measure of the correctness of the prediction of the model. Higher accuracy is always better and is calculated by (TN + TP)/Total number of rows *100 False discovery rate are the false positive measures of confusion matrix where the model predicts that the passenger would survive but in reality, it doesn’t. This would prove dangerous as the prediction may go wrong and hampers the accuracy of the results. The attempts are being made to increase the accuracy rate and reduce the false discovery rates. 4. CONCLUSIONS The logistic regression provides a better accuracy i.e. almost of about 95%. It works better with binary dependent variable which means the variable has a binary value as its output like yes or no, true or false. ISO 9001:2008 Certified Journal | Page 90 International Research Journal of Engineering and Technology (IRJET) e-ISSN: 2395-0056 Volume: 06 Issue: 08 | Aug 2019 p-ISSN: 2395-0072 www.irjet.net Fig 2: Confusion Matrix [4] Lonnie Stevans, David L. Gleicher,” Who Survived the Titanic? A logistic regression analysis”-Article in International Journal of Maritime History, December 2004. [5] MICHAEL AARON WHITLEY, using statistical learning to predict survival of passengers on the RMS Titanic by Michael Aaron Whitley, 2015. [6] Bircan H., Logistic Regression Analysis: Practice in Medical Data, Kocaeli University Social Sciences Institute Journal, 2004 / 2: 185- 208 [7] Atakurt, Y., 1999, Logistic Regression Analysis and an Implementation in Its Use in Medicine, Ankara University Faculty of Medicine Journal, C.52, Issue 4, P.195, Ankara [8] Kaggle, Titanic: Machine Learning form Disaster [Online]. Available: http://www.kaggle.com/ The ROC curve is the plotting of the output based on the false positive rate and the true positive rate plotted along x and the y-axes. The Curve depicts the performance of various algorithms on the same data which helps to compare the performance, accuracy and efficiency of the algorithm. It helps to decide the best algorithm which is suitable for user’s requirement. REFERENCES [1] Analyzing Titanic disaster using machine learning algorithms-Computing, Communication and Automation (ICCCA), 2017 International Conference on 21 December 2017, IEEE. [2] Prediction of Survivors in Titanic Dataset: A Comparative Study using Machine Learning Algorithms, Tryambak Chatterlee, IJERMT-2017. [3] MICHAEL AARON WHITLEY, using statistical learning to predict survival of passengers on the RMS Titanic by Michael Aaron Whitley, 2015. © 2019, IRJET | Impact Factor value: 7.34 | ISO 9001:2008 Certified Journal | Page 91


