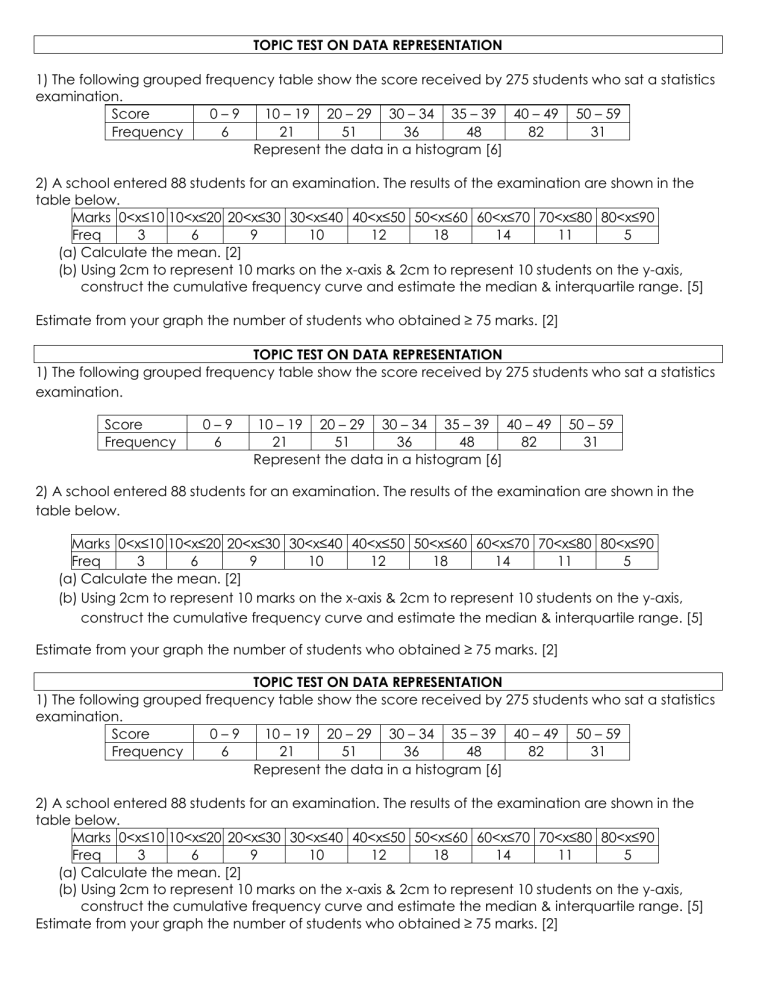
TOPIC TEST ON DATA REPRESENTATION 1) The following grouped frequency table show the score received by 275 students who sat a statistics examination. Score 0–9 10 – 19 20 – 29 30 – 34 35 – 39 40 – 49 50 – 59 Frequency 6 21 51 36 48 82 31 Represent the data in a histogram [6] 2) A school entered 88 students for an examination. The results of the examination are shown in the table below. Marks 0<x≤10 10<x≤20 20<x≤30 30<x≤40 40<x≤50 50<x≤60 60<x≤70 70<x≤80 80<x≤90 Freq 3 6 9 10 12 18 14 11 5 (a) Calculate the mean. [2] (b) Using 2cm to represent 10 marks on the x-axis & 2cm to represent 10 students on the y-axis, construct the cumulative frequency curve and estimate the median & interquartile range. [5] Estimate from your graph the number of students who obtained ≥ 75 marks. [2] TOPIC TEST ON DATA REPRESENTATION 1) The following grouped frequency table show the score received by 275 students who sat a statistics examination. Score Frequency 0–9 6 10 – 19 20 – 29 30 – 34 35 – 39 40 – 49 21 51 36 48 82 Represent the data in a histogram [6] 50 – 59 31 2) A school entered 88 students for an examination. The results of the examination are shown in the table below. Marks 0<x≤10 10<x≤20 20<x≤30 30<x≤40 40<x≤50 50<x≤60 60<x≤70 70<x≤80 80<x≤90 Freq 3 6 9 10 12 18 14 11 5 (a) Calculate the mean. [2] (b) Using 2cm to represent 10 marks on the x-axis & 2cm to represent 10 students on the y-axis, construct the cumulative frequency curve and estimate the median & interquartile range. [5] Estimate from your graph the number of students who obtained ≥ 75 marks. [2] TOPIC TEST ON DATA REPRESENTATION 1) The following grouped frequency table show the score received by 275 students who sat a statistics examination. Score 0–9 10 – 19 20 – 29 30 – 34 35 – 39 40 – 49 50 – 59 Frequency 6 21 51 36 48 82 31 Represent the data in a histogram [6] 2) A school entered 88 students for an examination. The results of the examination are shown in the table below. Marks 0<x≤10 10<x≤20 20<x≤30 30<x≤40 40<x≤50 50<x≤60 60<x≤70 70<x≤80 80<x≤90 Freq 3 6 9 10 12 18 14 11 5 (a) Calculate the mean. [2] (b) Using 2cm to represent 10 marks on the x-axis & 2cm to represent 10 students on the y-axis, construct the cumulative frequency curve and estimate the median & interquartile range. [5] Estimate from your graph the number of students who obtained ≥ 75 marks. [2] ANSWER FOR DATA REPRESENTATION 1) Boundary: -0.5 9.5 19.5 29.5 34.5 39.5 49.5 59.5 Freq Density: 0.6 2.1 5.1 7.2 9.6 8.2 3.1 2) 𝑥̅ = 4370 88 = 49.66 (b)median≈52; I.Q.R =66 – 32 ≈32 (c) 11 students

