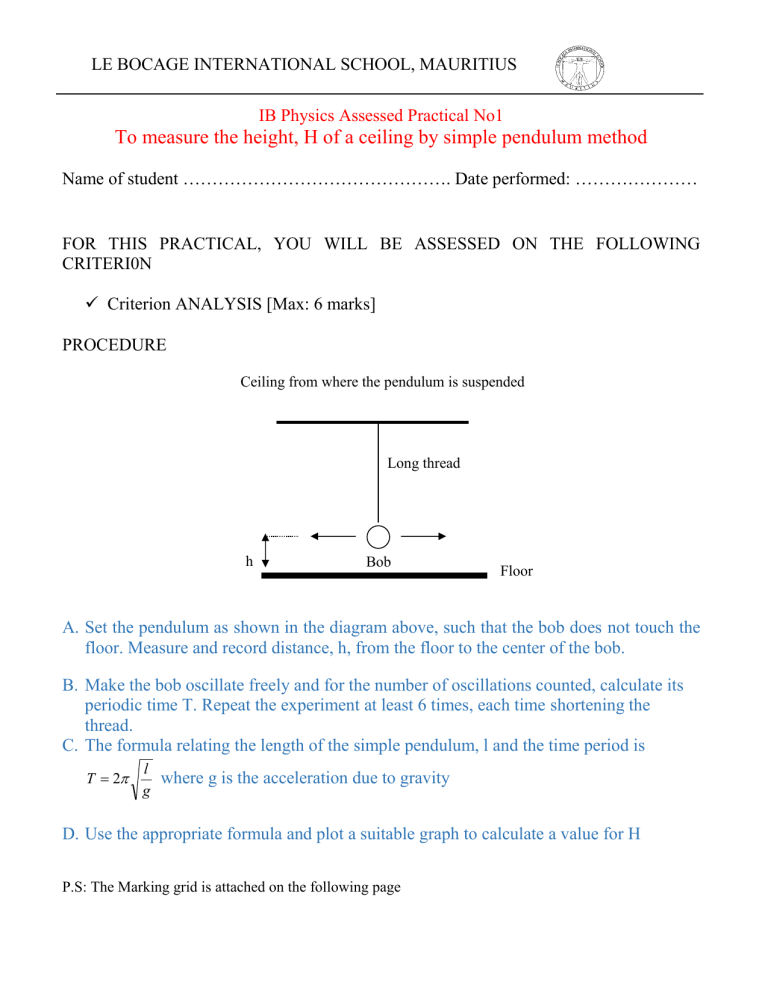
LE BOCAGE INTERNATIONAL SCHOOL, MAURITIUS IB Physics Assessed Practical No1 To measure the height, H of a ceiling by simple pendulum method Name of student ………………………………………. Date performed: ………………… FOR THIS PRACTICAL, YOU WILL BE ASSESSED ON THE FOLLOWING CRITERI0N Criterion ANALYSIS [Max: 6 marks] PROCEDURE Ceiling from where the pendulum is suspended Long thread h Bob Floor A. Set the pendulum as shown in the diagram above, such that the bob does not touch the floor. Measure and record distance, h, from the floor to the center of the bob. B. Make the bob oscillate freely and for the number of oscillations counted, calculate its periodic time T. Repeat the experiment at least 6 times, each time shortening the thread. C. The formula relating the length of the simple pendulum, l and the time period is T 2 l where g is the acceleration due to gravity g D. Use the appropriate formula and plot a suitable graph to calculate a value for H P.S: The Marking grid is attached on the following page Analysis This criterion assesses the extent to which the student’s report provides evidence that the student has selected, recorded, processed and interpreted the data in ways that are relevant to the research question and can support a conclusion. 0 Marks Aspect 1 Raw Data Does not reach the standard of the descriptors Aspect 2 Data Processing Does not reach the standard of the descriptors Aspect 3 Measuremen t Uncertainty Does not reach the standard of the descriptors Aspect 4 Interpretation of Data Does not reach the standard of the descriptors 1 - 2 marks 3 - 4 marks 5 - 6 Marks Insufficient relevant quantitative raw data to support a valid conclusion to the research question. Relevant but incomplete quantitative raw data is included that could support a simple or partially valid conclusion to the research question. All appropriate quantitative raw data is included , recorded to an appropriate precision, that can support a fully valid conclusion to the research question Insufficient relevant qualitative raw data is included Some appropriate qualitative raw data is included All appropriate qualitative raw data is included. Some basic data processing is carried out but is either too inaccurate or too insufficient to lead to a valid conclusion. Appropriate and sufficient data processing is carried out that could lead to a broadly valid conclusion but there are significant inaccuracies and inconsistencies in the processing. Appropriate and sufficient data processing is carried out with the accuracy required to enable a conclusion to the research question to be drawn that is fully consistent with the experimental data. Measurement uncertainties are not evident or are highly inappropriate.. Measurement uncertainties are evident in the results table and but are not justified. Measurement uncertainties are evident in the results table and justified. The processed data is incorrectly or insufficiently interpreted. For example, an inappropriate graph and stats test is applied. The processed data is correctly interpreted but there are some mistakes or omissions. For example, small errors in the graph chosen, an appropriate stats test has not been done. The processed data is correctly interpreted - an appropriate graph is drawn or a statistical test applied appropriately. Grade .


