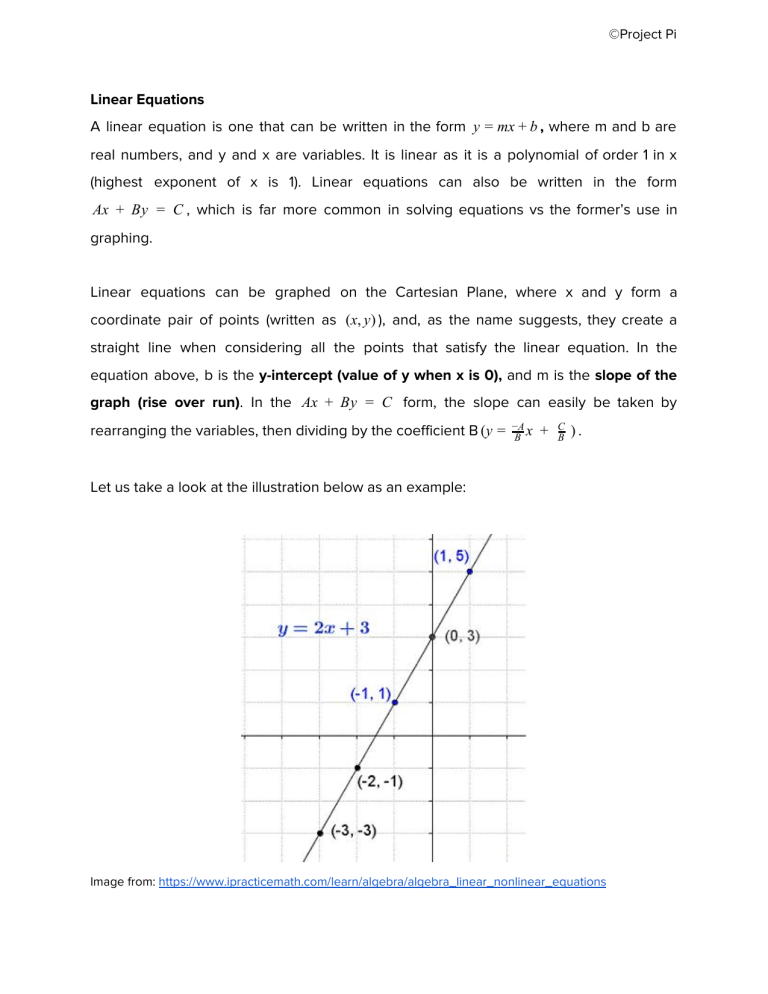
©Project Pi Linear Equations A linear equation is one that can be written in the form y = mx + b , where m and b are real numbers, and y and x are variables. It is linear as it is a polynomial of order 1 in x (highest exponent of x is 1). Linear equations can also be written in the form Ax + By = C , which is far more common in solving equations vs the former’s use in graphing. Linear equations can be graphed on the Cartesian Plane, where x and y form a coordinate pair of points (written as (x, y ) ), and, as the name suggests, they create a straight line when considering all the points that satisfy the linear equation. In the equation above, b is the y-intercept (value of y when x is 0), and m is the slope of the graph (rise over run). In the Ax + By = C form, the slope can easily be taken by rearranging the variables, then dividing by the coefficient B (y = −A x B + C B ). Let us take a look at the illustration below as an example: Image from: https://www.ipracticemath.com/learn/algebra/algebra_linear_nonlinear_equations ©Project Pi The line y = 2x + 3 is plotted above, showing several points. Substituting each of these points back into the equation will indeed show equality, e.g. (1, 5) ⇒ 2(1) + 3 = 5 If we were to determine the line’s equation from its graphical representation, we can first determine the slope via the equation y 2 −y 1 x2 −x1 , which is the mathematical equivalent of the aforementioned rise/run. Substituting points (1, 5) and (− 1, 1) back into the equation, we get m = 5−1 1−(−1) = 2 . As for the y-intercept, we simply need to check where the line intersects the y-axis, or the vertical, bolded line. Solving linear equations Linear equations can be solved quite easily as it requires nothing more than basic algebra. For example, we look at the equation 6(x − 5) = 2(x + 3) First, we distribute the constants to obtain an equation without parenthetical expressions: 6x − 30 = 2x + 6 Then, we may isolate the variables on one side and the constants on the other to obtain 6x − 2x = 6 + 30 Simplifying, we obtain 4x = 36 and finally, x=9 Solving for x in linear equations may often be more complex than this cited example, but do not require more than the above information. For example, solving 7x + 26 − 4(3x + 5) = 5(x + 2) uses naught more than the steps accompanied with GEMDAS applications from arithmetic. ©Project Pi Systems of equations Sometimes, questions may give two linear equations, looking for a coordinate pair (x,y) that satisfy both. Graphically, this pair is the point of intersection, as it lies on both lines. For example, let us use y = 5x + 6 and y = 2x − 4 . We call this pair of equations a system. To solve for the unknowns in the system, we can proceed by either using substitution or elimination. For the sake of demonstration, we’ll provide an example for both and show that they lead to the same answer. Let our two linear equations be: X + Y = 80 12Y + 19Y = 1184 Substitution This involves expressing one variable in terms of the other. Here, the first equation is simpler as the leading coefficients of X and Y are 1, so we let X = 80 − Y . Plugging this into the second equation (as we know the values X and Y must be the same in both equations), we obtain 12(80 − Y ) + 19Y = 1184 . This finally gives Y = 32 , which we can plug back into the first equation to obtain X = 48 . We can instead make Y the subject of the equation Y = 80 − X or even manipulate the second equation to produce the same results, albeit perhaps slower. This is an exercise left to the reader. Elimination In solving by elimination, we aim to get rid of a variable by means of subtracting or adding the two equations. In this case, we will choose to eliminate X first. As equality is preserved when manipulating both sides of an equation, what we can do is magnify the first equation by a factor of -12. ©Project Pi This gives: − 12X − 12Y = − 960 12X + 19Y = 1184 By adding these two equations, we obtain 7Y = 224 and Y = 32 . Notice that X is eliminated in this process, making it much simpler to solve in just one variable. From here, we can again obtain that X = 48 , and again, we may opt to instead eliminate Y to produce the same results. Again, this is an exercise left to the reader. Parallel and Perpendicular lines Graphically speaking, parallel lines are lines that never intersect. In the coordinate plane, this can be represented as two lines with equal slopes and different y-intercepts, as the lines will never “catch up” to one another, having the same value for rise/run at every increment. For example, y = 2x + 3 and y = 2x − 5 are parallel to one another. Perpendicular lines, on the other hand, are those whose slopes are negative reciprocals of each other, i.e. their product is -1. For example, the lines y = 2x + 3 and y = − 12 x + 5 are perpendicular. Horizontal and Vertical Lines Recall that the equation for the slope of a line is y 2 −y 1 x2 −x1 . For example, a horizontal line passing through the points (0,3) and (1,3). Using this equation, we find that the slope is 0 1 , which is equal to 0. All horizontal lines have a slope of 0, because when the rise in rise/run is zero, any number that zero divides is equal to zero, Vertical lines, on the other hand, have an undefined slope, because they have an infinite rise over a run of 0, and we know that anything divided by 0 is undefined. ©Project Pi Collinear Lines Collinear lines are simply a set of lines that have the same equation when simplified. For example, y = 2x + 4 and 2y = 4x + 8 are collinear to one another. Midpoint of Two Points If one were to connect two points by a straight line, then infinitely many points would also be present on this line, among which is the midpoint. Particularly, the midpoint, denoted as M, of line segment AB, is the point on AB such that AM = BM. Given points A(x1 , y 1 ) and B(x2 , y 2 ) , then M( x! +x2 y 1 +y 2 articularly, the midpoint has coordinates 2 , 2 ). P equal to the average of the two endpoints. Distance Formula It is known that the shortest path between any two points is a straight line segment. The length of this segment is easy to calculate had the points been on a vertical or horizontal line, but this is not always the case. Thus, the distance formula states given two points A(x1 , y 1 ) and B(x2 , y 2 ) , AB = √(x 1 − x2 )2 + (y 1 − y 2 )2 . Solving for the equation of a line given different informations • The standard form: Ax + By = C where A, B, and C are all integers, and A, B =/ 0 . • The slope-intercept form: y = mx + b If both slope (m) and y-intercept (b) are known, the above equation can be used. The equation’s form is extremely popular for graphing as one can directly obtain corresponding values for y from plugging in x. ©Project Pi • The point-slope form: y − y 1 = m(x − x1 ) Given just a single point that lies on a line and the line’s respective slope, this form can be used to determine the line’s equation. It can then be expanded and rearranged to obtain the slope-intercept form. • The two-point form: y − y1 = y 2 −y 1 x2 −x1 (x − x1 ) This form is similar to the point-slope form, other than m being replaced by the rise/run expression. y • The two-intercept form: ax + b = 1 Given that a line has x-intercept (a,0) and y-intercept (0,b), the equation above can be used to calculate the line’s equation without getting the slope. Getting rid of the denominators will lead to the equation’s standard form. Example: Find the equation of the line which passes through the points (1, 2) and (4, 8) Solution: We will present two solutions. The first involves solving for the equation’s slope and y-intercept, while the second uses the two-point equation shown above. Slope-intercept By the slope formula, m = 8−2 4−1 = 2. Plugging this into the slope-intercept form, we have y = 2x + b By plugging in (1,2) into this equation, we obtain: 2 = 2(1) + b ⇒ b = 0 Thus, the line has equation y = 2x . We can verify that (4,8) satisfies this equation. ©Project Pi Two-Point By letting y − 2 = 8−2 (x 4−1 (x1 , y 1 ) = (1, 2) and (x2 , y 2 ) = (4, 8) , we have the equation to be − 1) ⇒ y − 2 = 2(x − 1) ⇒ y = 2x , which is the same as above. Intersection of Linear Equations In regards to the intersection of two linear equations, there are only 3 possible cases. They are as follows: Case 1: The 2 lines only intersect at 1 point. In the point slope form, this occurs when the values for m are different. Case 2: The lines overlap, and there are infinitely many points of intersection. In the point-slope form, this occurs when the values for m and b are the same. ©Project Pi Case 3: the lines are parallel, and therefore do not have any intersection points. In the point-slope form, this occurs when the value for m is the same, but not b. Linear Inequalities ©Project Pi Linear inequalities are expressions that involve inequalities of linear functions. These inequalities four distinct forms: Greater than > or “greater than” signifies that the solution is the set of coordinates above the linear function. Keep in mind that the linear function itself is not included in the set of coordinates and is graphed with a dotted line. Graph with a positive slope. Graph with negative slope Less than < or “less than” is signifies that the solution is the set of coordinates below the linear function. Keep in mind that the linear function itself is not included in the set of coordinates and is graphed with a dotted line Graph with a positive slope. Graph with a negative slope ©Project Pi Greater than or equal to ≥ or “greater than or equal to” signifies that the solution is the set of coordinates above the linear function. Keep in mind that the linear function itself is included in the set of coordinates and is graphed with a full line Graph with a positive slope. Graph with a negative slope Less than or equal to ≤ or “less than or equal to” signifies that the solution is the set of coordinates below the linear function. Keep in mind that the linear function itself is included in the set of coordinates and is graphed with a full line Graph with a positive slope. Graph with a negative slope


