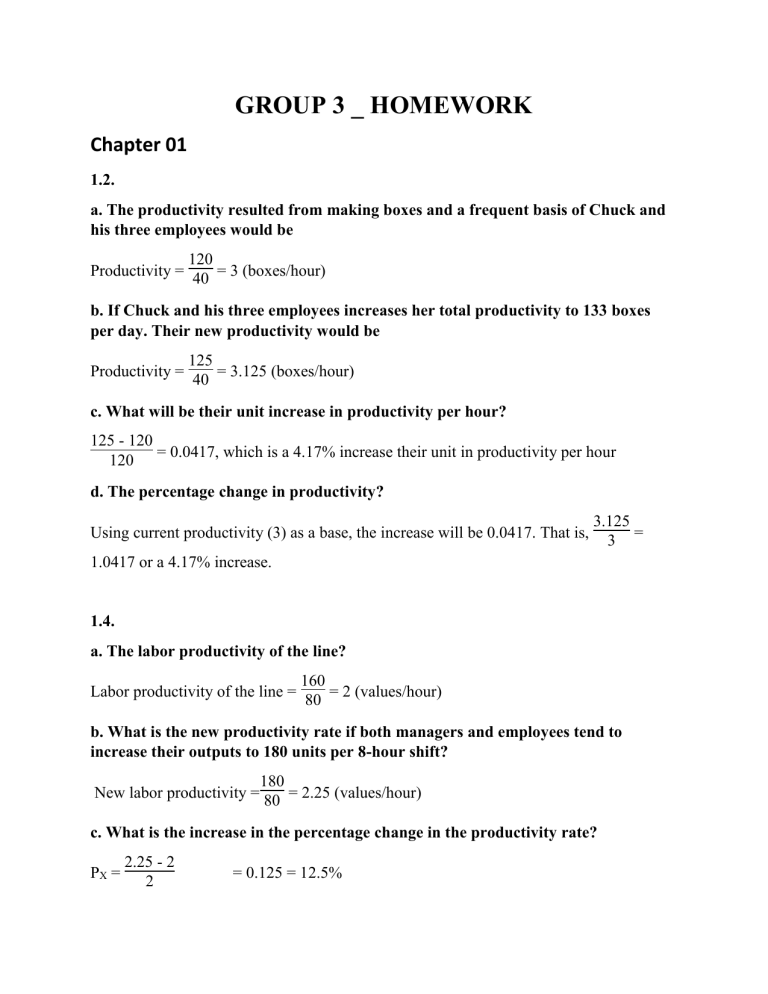
GROUP 3 _ HOMEWORK Chapter 01 1.2. a. The productivity resulted from making boxes and a frequent basis of Chuck and his three employees would be Productivity = 120 = 3 (boxes/hour) 40 b. If Chuck and his three employees increases her total productivity to 133 boxes per day. Their new productivity would be Productivity = 125 = 3.125 (boxes/hour) 40 c. What will be their unit increase in productivity per hour? 125 - 120 = 0.0417, which is a 4.17% increase their unit in productivity per hour 120 d. The percentage change in productivity? Using current productivity (3) as a base, the increase will be 0.0417. That is, 3.125 = 3 1.0417 or a 4.17% increase. 1.4. a. The labor productivity of the line? Labor productivity of the line = 160 = 2 (values/hour) 80 b. What is the new productivity rate if both managers and employees tend to increase their outputs to 180 units per 8-hour shift? New labor productivity = 180 = 2.25 (values/hour) 80 c. What is the increase in the percentage change in the productivity rate? PX = 2.25 - 2 2 = 0.125 = 12.5% 1.5. According to the Bureau of Labor Statistics, the U.S. national economy increased to 2.6% in this year. Additionally, the rate of Manufacturing sector rose by roughly 0.1% in this year. While the rate of service sector in U.S.A had a slight lull of approximately 0.1%, which was equal to the increase in the percentage change on the manufacturing sector in America. The table below shows statistical information: Last year 1.3% 1.0% 1.9% a. National economy b. Manufacturing sector c. Service sector This year 2.6% 1.1% 1.8% 1.8. Productivity for 1 month last year = 1000 (300 x 10) + (50 x 5) + (0.01 x 10000) + (3000 x 0.5) = 0.206 (units/dollar) Productivity for 1 month this year = 1000 (275 x 10) + (45 x 5) + (0.01 x 11000) + (2850 x 0.5) = 0.222 (units/dollar) Percentage in productivity: PX = 0.222 - 0.206 = 0.078 = 7.8% 0.206 1.14. a. The productivity rate before and after the change of the company: Productivity before the change = Productivity after the change = 500 = 25 (boxes/hour) 2 x 10 650 = 27.083 (boxes/hour) 3x8 b. The percentage increase in productivity? PX = 27.083 - 25 = 0.083 = 8.3% 25 The productivity after the change increase to 8.3% c. What will be the new productivity rate if production is capable of being increased to 700 boxes per day requiring three 8-hour? Productivity = PX = 700 = 29.17 (boxes/hour) 3x8 29.17 - 27.083 = 0.077 = 7.7% 27.083 Chapter 02 2.2 + Differentiation Strategy: means companies provide reasonable value at a lower price. Firms do this by continuously improving operational efficiency. Example: Phuong Trang Transportation Company follows the differentiation strategy. In long-distant transportation, it differentiates itself with rivals via service quality. The selling price of tickets is the same as competitors but the service of transport is better. It provides shuttle buses to pick up clients to and from their home. Besides, service attitude of staff is better than rivals. They are friendly and helpful. Clients are happy and Phuong Trang is very successful in gain loyalty of customers. + Cost Strategy: means companies deliver better benefits than anyone else. A firm can achieve differentiation by providing a unique or high-quality product. Another method is to deliver it faster. A third is to market in a way that reaches customers better. A company with a differentiation strategy can charge a premium price. Example: Acer is one of largest PC manufacturers in the world. Its markets are around the world. Its PC products are selling at the lowest price compared to rivals. Acer uses cost leadership strategy to a large range of customers. With the same features, Acer laptops are always cheaper than its rivals. Such as, ACER E1 is selling at VND 6,990,000 equally to HP CQ45 and lower than Lenovo G400. However, ACER E1 531 offers bigger screen at 15.6 inches and HDD at 500GB more storage capacity than HP CQ45’s HDD at 320 GB only. It brings more features and benefits to buyers than rivals do. This strategy gives Acer a competitive advantage in gaining and maintaining its market shares. + Response: means the company's leaders understand and service their target market better than anyone else including the entire range of values ralated to timely product development , as well as reliable scheduling and flexible performance. Example: While individual restaurants have long had their own food delivery services, UberEATS is changing the game for both businesses and consumers. Using the associated app, users simply select one of the daily meals from selected restaurants in their area and place an order. An Uber driver then delivers food in 10 minutes or less. All payment takes place through the app, meaning there’s no need to scrounge up cash for a driver tip. With meals typically ranging between $8 and $12, and a flat fee charge for each request (not the number of meals), it’s cheap, simple and extremely easy. 2.4 The changes in the external environment affect the OM strategy for a company: a) A major increase in oil prices can be evaluated with a manager’s resource view and value—chain analysis. For a producer with high energy costs, change in the cost structure, result in higher selling prices and the energy inefficient company, change in the competitive position. b) Water- and —air quality legislation would change the OM strategies in the areas of and geography. The impacts are difficult in predicting both the cost of production and the market demand. c) The impacts that fewer young prospective employees entering the labor market might have on OM strategy are increase unemployment rates and added capital investment for new equipment or processes. d) The impacts that inflation versus stable prices might have on OM strategy are difficulty in predicting both the cost of production and the market demand and Change in the income of employees in the lower pay classifications. e) The impacts legislation moving health insurance from a pretax benefit to taxable income might have on OM strategy are decrease in the take-home pay of employees by the amount of the taxes and operations managers get pressure to increase wages of employees in the lower pay classifications. 2.5 1. Cost leadership: Wal- Mart On a day to day basis, the big retailer has used the strategy of providing low price to customer. It “lives” by that strategy and doing so has made it one if not the best retailers out there. 2. Response: Pizza Hut Pizza Hut quickness in design, production and delivery. 3. Differentiation: Hard Rock Cafe Hard Rock Cafe idea sets it apart from the other coffee chains. It is dining experience. 2.8 CULTURE SELECTION CRITERION Trust Society value of quality work Religious attitudes Individualism attitudes Time orientation attitudes Uncertainty avoidance attitudes Total weighted score IMPORTANCE WEIGHT 0.4 0.2 0.1 0.1 0.1 0.1 MEXICO 1 7 3 5 4 3 3.3 PANAMA COSTA RICA 2 10 3 2 6 2 4.1 2 9 3 4 7 4 4.4 MEXICO: (0.4*1)+(0.2*7)+(0.1*3)+(0.1*5)+(0.1*4)+(0.1*3)= 3.3 PANAMA: (0.4*2)+(0.2*10)+(0.1*3)+(0.1*2)+(0.1*6)+(0.1*2)= 4.1 COSTA RICA: (0.4*2)+(0.2*9)+(0.1*3)+(0.1*4)+(0.1*7)+(0.1*4)= 4.4 PERU: (0.4*1)+(0.2*10)+(0.1*5)+(0.1*8)+(0.1*3)+(0.1*2)= 4.2 So, Ranga Ramasesh should select Costa Rica, which has the highest overall rating. PERU 1 10 5 8 3 2 4.2 Chapter 05 5.1 5.2 5.3 Comfortable Smooth ride Lightweight Folding Fashionable Carrying heavy loads Lower gear range Colorful models Aluminum components Smaller wheels Semi-smooth tread Large paddle seat 5.4 5.5 (a) Bill of Material for a Pair of Glasses in a Case Part Number Description Quantity G1001 Sun Ban Large in Black Case 1 CBL101 Black Leather Case 1 BF101 Black Leather Front 1 BB101 Black Leather Back 1 BC101 Black Leather Pocket Clip 1 SBL101 Sun Ban Large Glasses 1 SFA101 Frame Assembly 1 SF101 Alloy Frame 1 RL101 Right Sun Ban Large Lens 1 LL101 Left Sun Ban Large Lens 1 LTA101 Left Temple Assembly—Large 1 LT101 Left Temple 1 LTH101 Left Temple Hinge 1 LTE101 Left Temple Ear Pad 1 RTA101 Right Temple Assembly—Large 1 RT101 Right Temple 1 RTH101 Right Temple Hinge 1 RTE101 Right Temple Ear Pad 1 S1001 Hinge Screws 2 (b) There are obviously a very large number of possibilities, Quizno’s Honey-baconturkey club, regular size, uses a toasted 6″ bun (white or wheat), two slices of bacon, three ounces of smoked sliced turkey. 2 Tbsp. shredded lettuce, 1 Tbsp. chopped onion, and 1/2 oz. Honey-mustard sauce. It is wrapped in a 12″ square deli paper. 5.6 Assembly Chart for the ballpoint pen. Alternate Assembly Chart for the ballpoint pen 5.7 5.8 5.9 Product Alpha: 1,000 units × $2,500 = $2,500,000 Introductory Product Bravo: 1,500 units × $3,000 = $4,500,000 Growth Product Charlie: 3,500 units × $1,750 = $6,125,000 Decline A product-by-value report such as this poses an interesting challenge for management. Here we have product Charlie, whose sales are declining producing the highest annual contribution to the firm. Products Alpha and Bravo appear to be doing well on modest sales. And because they are in the introductory and growth stages respectively, both may warrant more capacity and R&D. Product Bravo may also warrant a focus on more efficient production and supplier and distribution development. 5.10 Possible strategies: Notebook computers (Growth phase): ■ Increase capacity and improve balance of production system ■ Attempt to make production facilities more efficient Palm-held computer (Introductory phase): ■ Increase R&D to better define required product characteristics ■ Modify and improve production process ■ Develop supplier and distribution systems Hand calculator (Decline phase): ■ Concentrate on production and distribution cost reduction ■ Attempt to develop improved product ■ Attempt to develop supplementary product ■ Unless product is of special importance to overall competitive strategy, consider terminating production 5.11 The firm should utilize the low technology approach for a cost of $145,000. 5.13 Low- tech Subcontract High tech Probality 0.3 0.4 0.3 0.7 0.2 0.2 0.9 0.1 Fixed cost $45000 $45000 $45000 $65000 $65000 $65000 $75000 $75000 Variable costs $200000*$0.55 $200000*$0.5 $200000*$0.45 $200000*$0.45 $200000*$0.4 $200000*$0.35 $200000*$0.4 $200000*$0.35 Total cost $155000 $145000 $135000 $155000 $145000 $135000 $155000 $145000 Multiplying the total cost by the probability for each branch, we find the following EMV’s Low- tech: 0.3 * 155000+ 0.4*145000+0.3*135000= $145000 Subcontract: 0.7* 155000+ 0.2*145000+0.1*135000= $151000 High Tech: 0.9*155000+0.1*145000=154000 Since we want the choice with the lowest EMV (i.e. the lowest potential costs to us) we would choose the low-tech option 5.14 describe how the options compare in terms of efficiency, economies of scale, and opportunity for customization: -Streamlined and/or improved product line efficiencies, developed by in-house manufacturing experts. -Discounts on bulk purchases of raw materials needed to create a company's products. -Investments in technology that, over time, pay for themselves by improving a company's rate and cost of production. -Economic growth in a company's industry that leads to stronger buyer demand and higher revenues. -Tax incentives provided by local, state and federal government designed to keep companies "in the stable" and lead to a lower cost of doing business. -Access to a stronger, smarter labor pool in a region where a company resides 5.15 Probability Elegen Quantity Price Total Expected Value Deluxe Quantity Price Total Expected Value 0.5 Good market 400 $125 $50000 0.5 Bad market 300 $90 $27000 $38500 Bad market 400 $70 28000 $39000 Good market 500 $100 50000 Therefore, he would choose Deluxe because it has the highest expected value. 5.16 Probability a. Quantity Price Total Expected Value b. Quantity Price Total Expected Value 0.6 Good market 100000 $550 $55000000 Good market 75000 $750 56250000 0.4 Bad market 750000 $550 $41250000 $49500000 Bad market 70000 $750 52500000 52500000-100000 (cost)=52400000 Therefore, case b has the highest expected monetary value (EMV) 5.17 Probality 0.4 0.5 0.1 0.2 0.4 0.3 0.1 0.1 0.3 0.4 0.2 Fixed cost $14000 $14000 $14000 $14000 $14000 $14000 $14000 $14000 $14000 $14000 $14000 Variable costs 30000 Total cost 5.18 a. The organization RTZ has to decide on whether to make or purchase the semiconductors that are used in production of wrist TV. The organization expects to produce 1 million units. If the organization decides to make the product, the production cost $1 million. On the other hand, if the organization decides to purchase the semiconductor, the cost of production is total of $0.50 for each unit to be produced plus the vendor cost of $1 million The cost for making the semiconductor can be calculated as follows: Total cost= (1million*0.9*0.6) + (1milion*0.4)= $940000 The cost for purchasing the semiconductor can be calculated as follows: Total cost= 1million* 0.5+1milion=$1500000 The company should option to make the semiconductor as it incurs low cost when compared to that of purchasing it. 5.19 McBurger, Inc. wants to redesign its kitchens to improve productivity and quality. Three designs, called designs K1, K2, and K3, are under consideration. No matter which design is used, daily demand for sandwiches at a typical McBurger restaurant is for 500 sandwiches. A sandwich costs $1.30 to produce. Non-defective sandwiches sell, on the average, for $2.50 per sandwich. Defective sandwiches cannot be sold and are scrapped. The goal is to choose a design that maximizes the expected profit at a typical restaurant over a 300-day period. Designs K1, K2, and K3 cost $100 000, $130 000, and $180 000 respectively. Under design K1, there is a .80 chance that 90 out of each 100 sandwiches are non-defective and a .20 chance that 70 out of each 100 sandwiches are non-defective. Under design K2, there is a .85 chance that 90 out of each 100 sandwiches are non-defective and a.15 chance that 75 out of each 100 sandwiches are non-defective. Under design K3, there is a .90 chance that 95 out of each 100 sandwiches are non-defective and a .10 chance that 80 out of each 100 sandwiches are non-defective. What is the expected profit level of the design that achieves the maximum expected 300-day profit level? K1 K2 K3 Probality 0.8 0.2 0.85 0.15 0.9 0.1 Fixed cost 500*2.5=$1250 $1250 $1250 $1250 $1250 $1250 Variable costs $100000*(90/100) $100000*(70/100) $130000*(90/100) $130000*(75/100) $180000*(95/100) $180000*(80/100) K1: $91250*0.8+ $71250*0.2=$87250; $87250*300=26175000 K2: $118250*0.85+$98750*0.15=$115325; $115325*300=$34597500 K3: 0.9*$172250+0.1*$144000=$169425; $169425*300=$50827500 => the maximum expected 300-day profit level Total cost $91250 $71250 $118250 $98750 $172250 $144000 5.20 + Another use of QFD is to show how the quality effort will be deployed. + Design characteristics of House 1 become inputs to house 2, which are satisfied by specific components of the product. Similarly, the concept is arried to house 3, where the specific components are to be satisfied thru particular production processes. Once production processes are defined, they become requirements of house 4 to be satisfied by quality plan that will ensure conformance of those processes + The quality plan is a set of specific tolerances, procedures, methods and sampling techniques that will ensure the production process meets the customer requirements + The series of houses helps operation managers how to deploy production resources to achieve customer requirements 5.21
