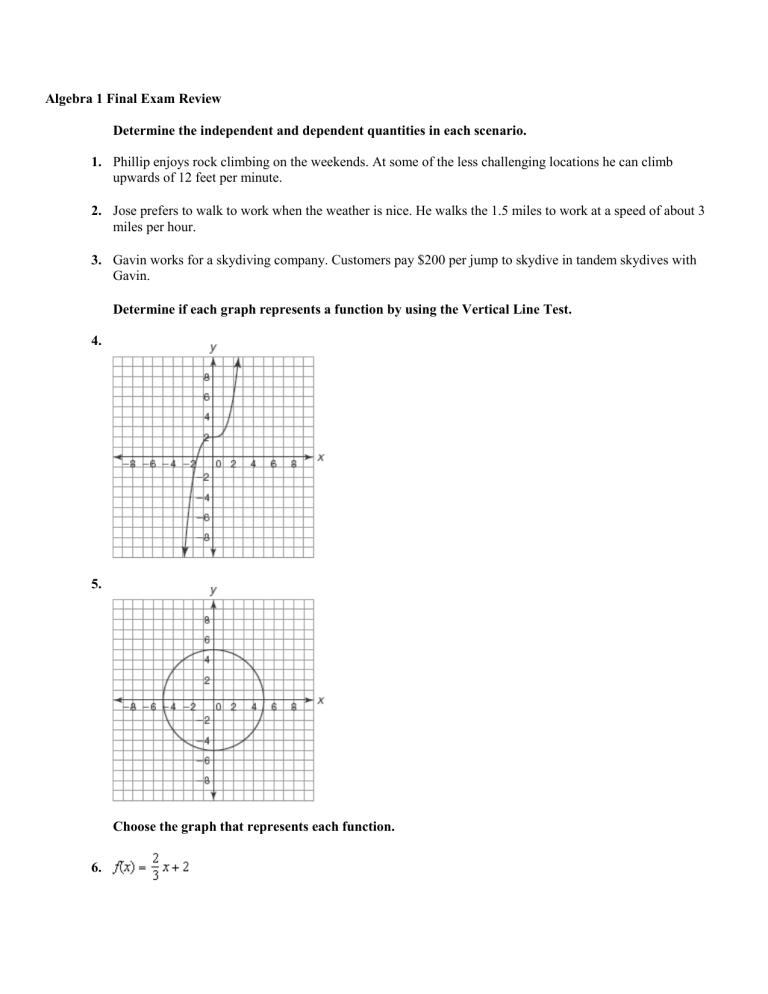
Algebra 1 Final Exam Review Determine the independent and dependent quantities in each scenario. 1. Phillip enjoys rock climbing on the weekends. At some of the less challenging locations he can climb upwards of 12 feet per minute. 2. Jose prefers to walk to work when the weather is nice. He walks the 1.5 miles to work at a speed of about 3 miles per hour. 3. Gavin works for a skydiving company. Customers pay $200 per jump to skydive in tandem skydives with Gavin. Determine if each graph represents a function by using the Vertical Line Test. 4. 5. Choose the graph that represents each function. 6. Graph A Graph B Graph C 7. Graph A Graph B Graph C Determine whether each graph represents an increasing function, a decreasing function, a constant function, or a combination of increasing and decreasing functions. 8. 9. 10. Determine whether each graph represents a function with an absolute minimum, an absolute maximum, or neither. 11. 12. 13. Write an inequality for each graph. 14. 15. Write a compound inequality for the situation. 16. The flowers in the garden are 6 inches or taller or shorter than 3 inches. Represent the solution to each part of the compound inequality on the number line. Then write the final solution that is represented by each graph. 17. and 18. or 19. and 20. Solve the compound inequality. Then graph and describe the solution. 21. or 22. Solve each linear absolute value equation. 23. 24. 25. The basketball booster club runs the concession stand during a weekend tournament. They sell hamburgers for $2.50 each and hot dogs for $1.50 each. They hope to earn $900 during the tournament. The equation represents the total amount the booster club hopes to earn. Use this equation to determine each unknown value. 26. If the booster club sells 420 hot dogs during the tournament, how many hamburgers must they sell to reach their goal? 27. If the booster club sells 0 hot dogs during the tournament, how many hamburgers must they sell to reach their goal? Determine the x-intercept and the y-intercept of each equation. 28. 29. 30. Solve each equation for the variable indicated. 31. The formula for the volume of a sphere is . Solve the equation for r. Write a function to represent each problem situation. 32. Carmen deposits $1000 into a simple interest account. The interest rate for the account is 4%. Write a function that represents the balance in the account as a function of time t. 33. Chen deposits $1200 into a compound interest account. The interest rate for the account is 3.5%. Complete each table and graph the function. Identify the x-intercept, y-intercept, asymptote, domain, range, and interval(s) of increase or decrease for the function. 34. x f(x) 0 1 2 How does the graph of g(x) compare to the graph of the parent function f(x)? 35. 36. For #37 write a system of linear equations to represent each problem situation. Define each variable. Then, graph the system of equations and estimate the break-even point. Explain what the break-even point represents with respect to the given problem situation. 37. Olivia is building birdhouses to raise money for a trip to Hawaii. She spends a total of $30 on the tools needed to build the houses. The material to build each birdhouse costs $3.25. Olivia sells each birdhouse for $10. For #’s 38 and 39 write a system of equations to represent each problem situation. Solve the system of equations using the linear combinations method. 38. The high school marching band is selling fruit baskets as a fundraiser. They sell a large basket containing 10 apples and 15 oranges for $20. They sell a small basket containing 5 apples and 6 oranges for $8.50. How much is the marching band charging for each apple and each orange? 39. Taylor and Natsumi are making block towers out of large and small blocks. They are stacking the blocks on top of each other in a single column. Taylor uses 4 large blocks and 2 small blocks to make a tower 63.8 inches tall. Natsumi uses 9 large blocks and 4 small blocks to make a tower 139.8 inches tall. How tall is each large block and each small block? Solve each system of equations using the linear combinations method. 40. Determine the x-intercepts of each quadratic function in factored form. 41. 42. Determine the vertex of the parabola. 43. Determine another point on the parabola. 44. The vertex is . A point on the parabola is (4, 1). Identify the form of the quadratic function as either standard form, factored form, or vertex form. Then state all you know about the quadratic function’s key characteristics, based only on the given equation of the function. 45. Describe the transformation performed on each function g(x) to result in m(x). 46. 47. 48. Simplify each expression. 49. 50. 51. What is the product of the polynomials? 52. ( )( 53. ( )( ) ) Factor out the greatest common factor of each polynomial, if possible. 54. 27 55. -56 56. Factor each polynomial. If possible, factor out the greatest common factor first. 57. 58. Use the quadratic formula or factor to determine the exact roots of the function. 59. Use the discriminant to determine the number of roots the function has. Then solve for the roots. 60. Identify each given number using words from the box. natural number whole number integer rational number irrational number real number imaginary number complex number 61. 62. 63. A group of friends compared the number of books they read over the summer holidays. The table shows the number of books read per person. Books Per Person 3 7 8 1 2 8 11 7 a. Construct a dot plot to represent the data. Use the number line provided. b. Determine the values indicated for the data set. Minimum __________ Q1 __________ Q3 __________ 10 3 8 Lower Fence __________ Maximum __________ Median __________ IQR __________ Upper Fence __________ c. Does the data set have any outliers? Explain your reasoning. d. Construct a box-and-whisker plot of the data. Use the number line provided. 64. Use the double stem-and-leaf plot to answer the questions. Data Set A Data Set B 7 5 4 4 2 3 8 4 1 1 0 3 6 6 7 8 1 0 4 1 2 2 5 5 5 2 4 5|2 52 a. Describe the distribution of each data set. b. Is the mean or median the best measure of center for each data set? Explain your reasoning. c. Is the interquartile range (IQR) or standard deviation the best measure of spread for each data set? Explain your reasoning. 65. This histogram represents the high temperatures recorded each day for one month. a. How many days are represented on the histogram? b. How many days had a daily high temperature higher than 86 degrees Celsius? c. Suppose the two measures of center are 82.5 degrees and 83.6 degrees. Which of the values is the mean and which is the median? Explain your reasoning. 66. Missy is analyzing the scatter plot shown. She determines that this scatter plot must have a negative correlation because a negative correlation means the data is not linear. Is Missy correct? Tell why or why not. 67. Determine whether the points on the scatter plot have a positive correlation, a negative correlation, or no correlation. Then determine which r-value is most accurate. Explain your reasoning. • • • • 68. A teacher wants to break her students into two groups and assign each group a different book. She decides to group the boys together and the girls together. She surveys the students to determine their favorite genre of book to help her choose which book she will assign each group. The frequency marginal distribution shows the results of her survey. a. Construct a bar graph comparing the frequencies. Let the x-axis represent the gender of the students. b. Based on the graph, which genre should the teacher choose for each reading group? Explain your reasoning. ____ 69. Josh took a poll of the favorite types of desserts of a group of students. The graph shows his results. What can you conclude from the graph about the most popular dessert? a. b. c. d. Ice cream is the most popular dessert among 8th graders. Pie is the most popular dessert among 7th graders. Cake is more popular than pie among 8th graders. Candy is more popular than ice cream among 7th graders. 70. Write an equation for the line parallel to 71. Write an equation for the line perpendicular to through the point (6,7) through the point (-4, 8) Algebra 1 Final Exam Review Answer Section 1. ANS: Independent quantity: time (minutes) Dependent quantity: distance climbed (feet) REF: 1.1 2. ANS: Independent quantity: time (hours) Dependent quantity: distance (miles) REF: 1.1 3. ANS: Independent quantity: number of jumps Dependent quantity: cost (dollars) REF: 1.1 4. ANS: Yes. The graph is a function. REF: 1.2 5. ANS: No. The graph is not a function. REF: 1.2 6. ANS: Graph A REF: 1.3 7. ANS: Graph C REF: 1.3 8. ANS: The graph represents an increasing function. REF: 1.3 9. ANS: The graph represents a function with a combination of an increasing interval and a decreasing interval. REF: 1.3 10. ANS: The graph represents a constant function. REF: 1.3 11. ANS: The graph represents a function with an absolute maximum. REF: 1.3 12. ANS: The graph represents a function with an absolute minimum. REF: 1.3 13. ANS: Neither D(t)=120 is a constant function REF: 2.1 14. ANS: REF: 2.4 15. ANS: REF: 2.4 16. ANS: or REF: 2.4 17. ANS: REF: 2.4 18. ANS: REF: 2.4 19. ANS: No solution REF: 2.4 20. ANS: REF: 2.4 21. ANS: or Solution: REF: 2.4 22. ANS: REF: 2.5 23. ANS: REF: 2.5 24. ANS: There are no solutions. REF: 2.5 25. ANS: REF: 2.5 26. ANS: The booster club must sell 108 hamburgers to reach their goal. REF: 3.2 27. ANS: The booster club must sell 360 hamburgers to reach their goal. REF: 3.2 28. ANS: The x-intercept is and the y-intercept is (0, 168). REF: 3.2 29. ANS: The x-intercept is (13, 0) and the y-intercept is (0, 52). REF: 3.2 30. ANS: The x-intercept is approximately (24.43, 0) and the y-intercept is (0, 13.68). REF: 3.2 31. ANS: REF: 3.3 32. ANS: REF: 5.1 33. ANS: REF: 5.1 34. ANS: x f(x) 0 1 1 2 2 4 x-intercept: none y-intercept: (0, 1) asymptote: domain: all real numbers range: interval(s) of increase or decrease: increasing over the entire domain REF: 5.2 35. ANS: REF: 5.3 36. ANS: REF: 5.3 37. ANS: Olivia’s income can be modeled by the equation represents the number of birdhouses she sells. Olivia’s expenses can be modeled by the equation and x represents the number of birdhouses she builds. , where y represents the income (in dollars) and x , where y represents the expenses (in dollars) The break-even point is between 4 and 5 birdhouses. Olivia must sell more than 4 birdhouses to make a profit. REF: 6.1 38. ANS: Let x represent the amount charged for each apple. Let y represent the amount charged for each orange. The solution is . The band charges $0.50 for each apple and $1.00 for each orange. REF: 6.2 39. ANS: Let x represent the height (in inches) of each large block. Let y represent the height (in inches) of each small block. The solution is . Each large block is 12.2 inches tall and each small block is 7.5 inches tall. REF: 6.2 40. ANS: The solution is . REF: 6.2 41. ANS: The x-intercepts are (2, 0) and (8, 0). REF: 11.4 42. ANS: The x-intercepts are (1, 0) and (9, 0). REF: 11.4 43. ANS: The axis of symmetry is , so the x-coordinate of the vertex is . The y-coordinate when The vertex is is: . REF: 11.5 44. ANS: The axis of symmetry is x = 3. Another point on the parabola is a symmetric point that has the same y-coordinate as (4, 1). The x-coordinate is: Another point on the parabola is (2, 1). REF: 11.5 45. ANS: The function is in vertex form. The parabola opens down and the vertex is REF: 11.6 46. ANS: The graph of g(x) is translated left 2 units. REF: 11.7 47. ANS: The graph of g(x) is translated left 3 units. REF: 11.7 48. ANS: The graph of g(x) is translated right 5 units. REF: 11.7 49. ANS: REF: 12.1 50. ANS: . REF: 12.1 51. ANS: REF: 12.1 52. ANS: REF: 12.2 53. ANS: 2 REF: 12.2 54. ANS: REF: 12.3 55. ANS: REF: 12.3 56. ANS: REF: 12.3 57. ANS: The factors of the constant term, REF: 12.3 58. ANS: REF: 12.3 59. ANS: REF: 13.1 60. ANS: , are: Because the function has two zeros. REF: 13.1 61. ANS: integer, rational number, real number, complex number REF: 14.3 62. ANS: irrational number, real number, complex number REF: 14.3 63. ANS: a. b. Minimum Q1 3 Q3 8 Lower Fence 1 Maximum 11 Median 7 IQR 8 3 5 Upper Fence c. No. All values are between the lower fence and the upper fence. d. REF: 8.1 | 8.3 64. ANS: a. Data set A is skewed right. Data set B is symmetric. b. The median is the best measure of center for data set A because it is skewed. The mean is the best measure of center for data set B because the data is symmetric. c. The IQR is the best measure of spread for data set A because the median is the best measure of center. The standard deviation is the best measure of spread for data set B because the mean is the best measure of center. REF: 8.5 65. ANS: a. 7 9 6 5 3 30 days 3 8 days had a daily high temperature higher than 86 degrees Celsius. b. 5 c. The median is 82.5 degrees and the mean is 83.6 degrees. Since the data is skewed right, I know the mean will be to the right (higher) than the median. REF: 8.1 | 8.2 66. ANS: No. Missy is not correct. A negative correlation does not mean the data is not linear. A negative correlation means that the data have a negative slope. This data has no correlation. REF: 9.2 67. ANS: The data show a negative correlation. Because of this, the value of r must also be negative. Because the data are close to forming a straight line, would be the most accurate value. REF: 9.2 68. ANS: a. b. Answers will vary. She should choose a comedy book for the boy group and a historical fiction book for the girl group. These are the most popular genres in each group based on the survey information. REF: 10.1 69. ANS: B 70. ANS: y= -2/3x + 11 71. ANS: y = 1/2 x + 10 REF: 10.1
