08
advertisement
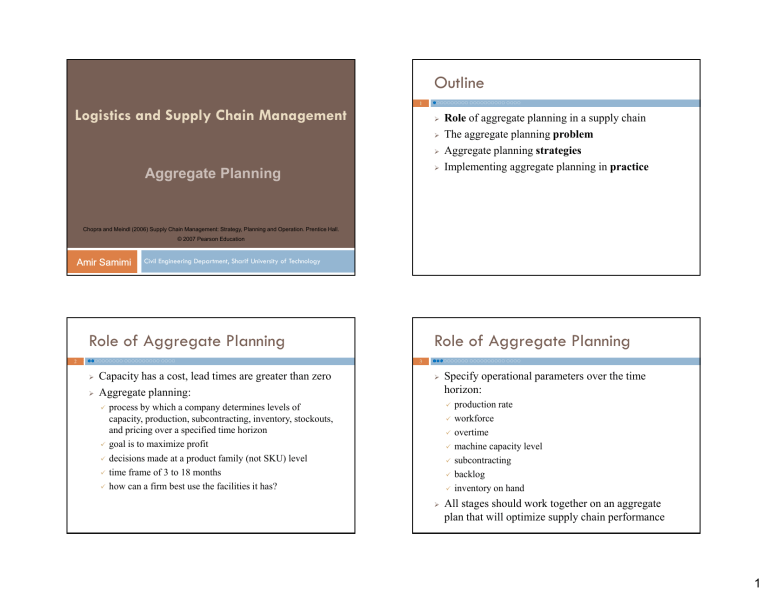
Outline 1 Logistics and Supply Chain Management Aggregate Planning Role of aggregate planning in a supply chain Th aggregate The t planning l i problem bl Aggregate planning strategies Implementing aggregate planning in practice Chopra and Meindl (2006) Supply Chain Management: Strategy, Planning and Operation. Prentice Hall. © 2007 Pearson Education Amir Samimi Civil Engineering Department, Sharif University of Technology Role of Aggregate Planning 2 Capacity has a cost, lead times are greater than zero A Aggregate t planning: l i Role of Aggregate Planning 3 Specify operational parameters over the time horizon: process by which a company determines levels of capacity, production, subcontracting, inventory, stockouts, and pricing over a specified time horizon goal is to maximize profit decisions dec s o s made de at a pproduct oduc familyy (not ( o SKU) S U) level eve time frame of 3 to 18 months how can a firm best use the facilities it has? production rate workforce overtime machine capacity level subcontracting backlog inventory on hand All stages should work together on an aggregate plan that will optimize supply chain performance 1 Aggregate Planning Problem 4 Information Needed 5 Given the demand forecast, determine the best production d ti level, l l inventory level, capacity level. Demand forecast in each period P d ti costs Production t labor costs: regular time and overtime subcontracting costs cost of changing capacity: hiring or layoff cost of adding or reducing machine capacity Specify the planning horizon duration of each period key required information Outputs 6 Production quantity to determine required warehouse space and working capital to determine what customer service levels will be Machine capacity increase/decrease: 7 using utilization as the lever Level strategy using capacity as the lever Time flexibility: workforce or capacity b t between capacity, it inventory, i t backlog/lost b kl /l t sales l Chase strategy to find if new production equipment needs to be purchased A poor aggregate plan can Trade-off Backlog/stockout quantity: Strategies Inventory regular time time, overtime, overtime and subcontracted time to determine number of workers and supplier purchase levels Labor/machine hours required q per p unit Inventory holding cost Stockout or backlog cost Constraints: limits on overtime, layoffs, capital available, stockouts and backlogs using inventory as the lever Mixed strategy lost sales, lost profits, excess inventory, or excess capacity 2 Chase Strategy 8 varying i machine hi capacity it hiring and laying off workers difficult to vary capacity and workforce on short notice Expensive if cost of varying capacity is high N ti effect Negative ff t on workforce kf confidence fid low levels of inventory Inventory costs are high and changing capacity is flexible 10 Constant output rate Case Study: Red Tomato Tools 11 Stable machine capacity and workforce levels Produce gardening tools Better for worker confidence High utilization peaking ki in i the th spring i Inventories are built up in anticipation of future demand Backlogs are carried over from high to low demand periods Used when Fluctuations in inventory levels over time Large inventories and backlogs may accumulate Inventory holding and backlog costs are relatively low To overcome the seasonality, Cons Inventory costs are high and capacity is inexpensive. Pros Lower utilization Used when Level Strategy Use a flexible work schedule Avoids morale problems L levels Low l l off inventory, i t Cons Fixedd workforce Fi kf andd variable i bl number b off hours h worked k d Excess machine capacity is available Pros Used when Working hours synchronize production and demand Pros Cons 9 Production rate is synchronized with demand Time Flexibility Strategy add workers during the peak season, subcontract out some of the work, build up inventory during the slow months, build up a backlog of orders that will be delivered later. How to best use these options through an aggregate plan? 3 Demand 12 Fundamental Tradeoffs Month January February March April M May June 13 Demand Forecast 1,600 3,000 3,200 3,800 2 200 2,200 2,200 Capacity (regular time, overtime, subcontract) Inventory Backlog / lost sales Basic Strategies Basic Information 14 Chase strategy gy Time flexibility from workforce or capacity Level strategy Decision Variables 15 Item Materials Inventory holding cost Marginal cost of a stockout Hiring and training costs Layoff cost L b hours Labor h required i d Regular time cost Over time cost Cost of subcontracting Cost $10/unit $2/unit/month $5/unit/month $300/worker $500/worker 4/ it 4/unit $4/hour $6/hour $30/unit t = Month (t = 1, …, 6) Wt = Workforce W kf size i for f month th Ht = Number of employees hired Lt = Number of employees laid off Pt = Production It = Inventoryy at the end of month St = Number of units stocked out at the end of month Ct = Number of units subcontracted for month t, Ot = Number of overtime hours worked in month t, 4 Objective Function 16 Constraints 17 Minimum 1. 6 Regular-time labor cost 640W t 1 t Workforce size for each month is based on hiring and layoffs 6 Overtime labor cost 6O t t 1 6 Cost of hiring and layoffs Cost of holding inventory Cost of stocking out 6 2I Cost of subcontracting t 5S t Material cost W W W 80 t t 6 30 C t 10 P t Constraints 19 Production for each month cannot exceed capacity 3. Inventory balance for each month I I S I t 1 P t 40W t O t 4 , for t 1,..., 6 P t C t D t S t 1 I t S t , 0 1000 0 0 6 for t 1,..., 6 0 Constraints 2. H t Lt 6 t 1 18 t 1 t 1 t 1 6 t 1 t t 1 t 1 6 300 H 500 L for t 1,..., 6 500 Each worker can produce 40 units per month on regular time 1 unit for every four hours of overtime 5 Constraints 20 Scenarios 4. 21 Over time for each month O t 10W t, for t 1,..., 6 No employee work more than 10 hours of overtime each month. in Practice 22 Increase in holding cost (from $2 to $6) O ti costt drops Overtime d to t $4.1 $4 1 per hour h Increased demand fluctuation Think beyond the enterprise to the entire supply chain Make plans flexible because forecasts are always wrong Rerun the aggregate plan as new information emerges Use aggregate planning l i as capacity i utilization ili i increases Summary 23 What types of decisions are best solved by aggregate planning? What is the importance of aggregate planning as a supply chain activity? What kinds of information are needed to produce an aggregate plan? What h are the h bbasic i trade-offs ff a manager makes k to produce an aggregate plan? How are aggregate planning problems formulated and solved using Microsoft Excel? 6 Homework 4 24 Chapter 8 E Exercises: i 4 5 6 7
