experiment huddling
advertisement

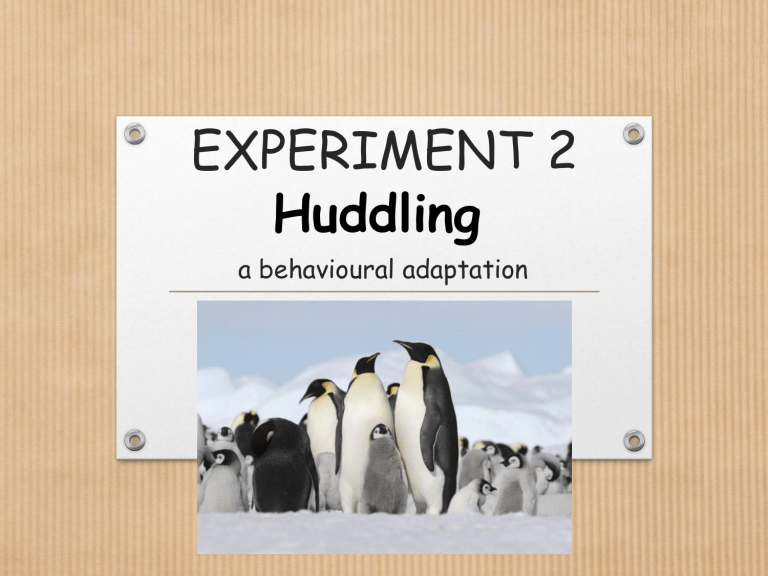
EXPERIMENT 2 Huddling a behavioural adaptation Emperor penguins huddles • Emperor penguins form large huddles to keep warm. It’s a behavioural adaptation. • Show video Question • Who will cool down faster, a penguin on its own, or a penguin in a huddle? Experiment • In this experiment, test tubes of hot water are grouped together as a model of penguins in a huddle. • The decrease in temperature over time is compared to a lone test tube of hot water. Resources needed • Test tubes or boiling tubes. • Beakers (to stand the huddled test tubes in). • • • • Elastic bands. Thermometers. Stopwatches. Kettles. Identifying variables • Independent: Whether the test tube is in a huddle or on its own. • Dependent: The decrease in water temperature over time. • Control: The same amount of water in each test tube. • Both the huddled and lone test tubes starting at the same point. Method • Boil water in a kettle. • Each group needs 8 test tubes. • 7 test tubes are arranged into a group, with one test tube at the centre, this can be secured with an elastic band and placed in a beaker to hold it upright. • The other is kept on its own. • Pour equal amounts of boiling water into the test tubes and start the timers. • Place the Thermometers into the lone test tube and the test tube at the centre of the huddle. • Take the temperature every minute for a period of time such as 12 minutes. Advices • Be carefull when handling hot water • Star the measurements of tempetarure as soon as posible after pourign the water. • You are going to work in groups of 3. You have to be coordinated (the water is cooling rapidly): • Student 1 measures the time. • Student 2 measures the temperature in the lone test tube. • Student 3 writes the results down. • You have to repeat the process with the test tube which is at the center of the huddle. What is the How could it be How will you hazard? dangerous? reduce the risk? Hot water Causes burns Take care when handling hot water Presenting results • These results can be presented as a line graph of time vs temperature with two data sets (one for the huddled test tube and one for the one test tube). Interpreting data and Conclusion • The lone test tube cooled faster than the huddled test tube. • Conclusion: The huddled test tube cools slower as there is a reduction in the surface area in contact with the cold air. Improvements • A suggested improvement would be to repeat the experiment to get more reliable results. • Taking the investigation further could be to increase the size of the huddle to get an additional set of data.


