Additional
advertisement
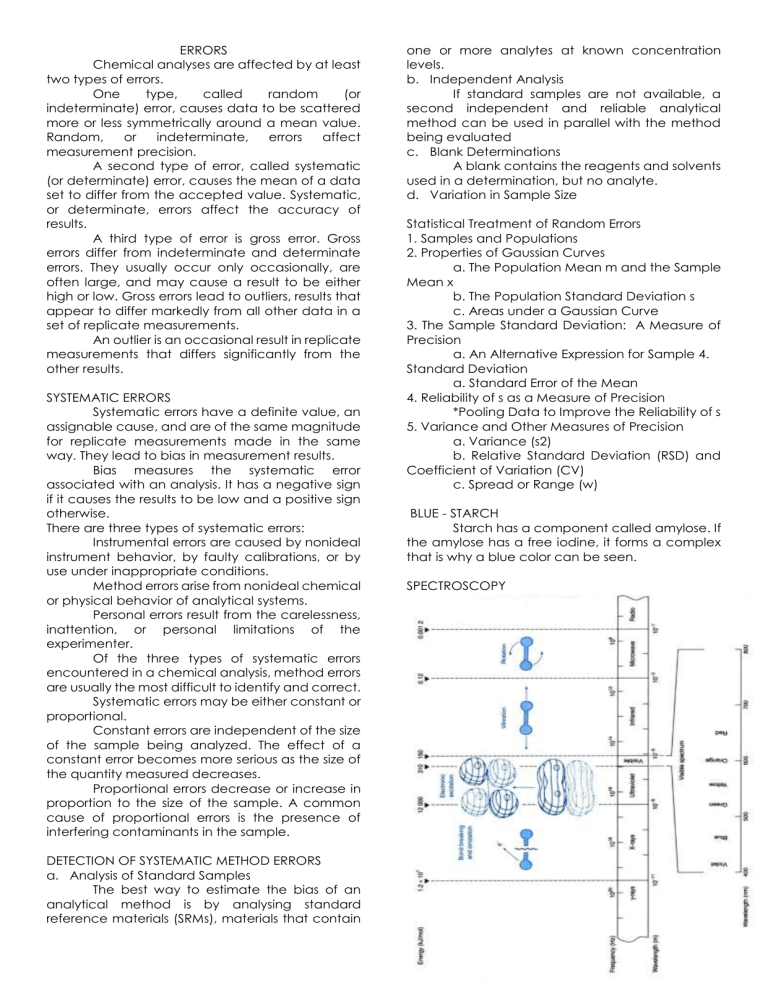
ERRORS Chemical analyses are affected by at least two types of errors. One type, called random (or indeterminate) error, causes data to be scattered more or less symmetrically around a mean value. Random, or indeterminate, errors affect measurement precision. A second type of error, called systematic (or determinate) error, causes the mean of a data set to differ from the accepted value. Systematic, or determinate, errors affect the accuracy of results. A third type of error is gross error. Gross errors differ from indeterminate and determinate errors. They usually occur only occasionally, are often large, and may cause a result to be either high or low. Gross errors lead to outliers, results that appear to differ markedly from all other data in a set of replicate measurements. An outlier is an occasional result in replicate measurements that differs significantly from the other results. SYSTEMATIC ERRORS Systematic errors have a definite value, an assignable cause, and are of the same magnitude for replicate measurements made in the same way. They lead to bias in measurement results. Bias measures the systematic error associated with an analysis. It has a negative sign if it causes the results to be low and a positive sign otherwise. There are three types of systematic errors: Instrumental errors are caused by nonideal instrument behavior, by faulty calibrations, or by use under inappropriate conditions. Method errors arise from nonideal chemical or physical behavior of analytical systems. Personal errors result from the carelessness, inattention, or personal limitations of the experimenter. Of the three types of systematic errors encountered in a chemical analysis, method errors are usually the most difficult to identify and correct. Systematic errors may be either constant or proportional. Constant errors are independent of the size of the sample being analyzed. The effect of a constant error becomes more serious as the size of the quantity measured decreases. Proportional errors decrease or increase in proportion to the size of the sample. A common cause of proportional errors is the presence of interfering contaminants in the sample. DETECTION OF SYSTEMATIC METHOD ERRORS a. Analysis of Standard Samples The best way to estimate the bias of an analytical method is by analysing standard reference materials (SRMs), materials that contain one or more analytes at known concentration levels. b. Independent Analysis If standard samples are not available, a second independent and reliable analytical method can be used in parallel with the method being evaluated c. Blank Determinations A blank contains the reagents and solvents used in a determination, but no analyte. d. Variation in Sample Size Statistical Treatment of Random Errors 1. Samples and Populations 2. Properties of Gaussian Curves a. The Population Mean m and the Sample Mean x b. The Population Standard Deviation s c. Areas under a Gaussian Curve 3. The Sample Standard Deviation: A Measure of Precision a. An Alternative Expression for Sample 4. Standard Deviation a. Standard Error of the Mean 4. Reliability of s as a Measure of Precision *Pooling Data to Improve the Reliability of s 5. Variance and Other Measures of Precision a. Variance (s2) b. Relative Standard Deviation (RSD) and Coefficient of Variation (CV) c. Spread or Range (w) BLUE - STARCH Starch has a component called amylose. If the amylose has a free iodine, it forms a complex that is why a blue color can be seen. SPECTROSCOPY ARGENTUMETRIC TITRATION Method Analyte Mohr Cl- Volhard Cl- Titration Reaction Ag+ + Cl- = AgCl(s) Ag+ + Cl- = AgCl(s) + x’s Ag+ Indicator CrO42- Fe3+ x’s Ag+ + SCN- = AgSCN(s) Fajan’s Cl- Mohr Method: Titrations are performed only in neutral or slightly basic medium to prevent silver hydroxide formation (at pH >10). 2Ag+ + 2OH = 2AgOH(s)= Ag2O(s) + H2O Or the formation of Chromic Acid at pH < 7 CrO42- + H3O = HCrO4- + H2O 2CrO42 + 2H3O+ = Cr2O72 + H2O WATER PARAMETERS -Density -Temperature -Dissolved Oxygen -Total Solids -Water Hardness -Salinity SINGLE-BEAM DOUBLE-BEAM Indicator Reaction 2Ag + CrO42- = Ag2CrO4(s) End Color Red Fe3+ + SCN- = FeSCN2+ Red Dichlorofluorescein Red SPECTROSCOPY Region UV (160375nm) Visible (3202500nm) Infrared Region Light Source Deuterium Lamp Sample Holder Quartz Light Detector Phototube Tungsten Lamp Glass Phototube NaCl, KBr HIGH SIGNAL TO NOISE RATIO High signal to noise ratio would mean greater value for signal. Noise depicts any factors that would alter tge accuracy negatively. Thus, a high ratio would mean more accurate readings.

