Operational Experience of the PLS Electric Power Plant
advertisement

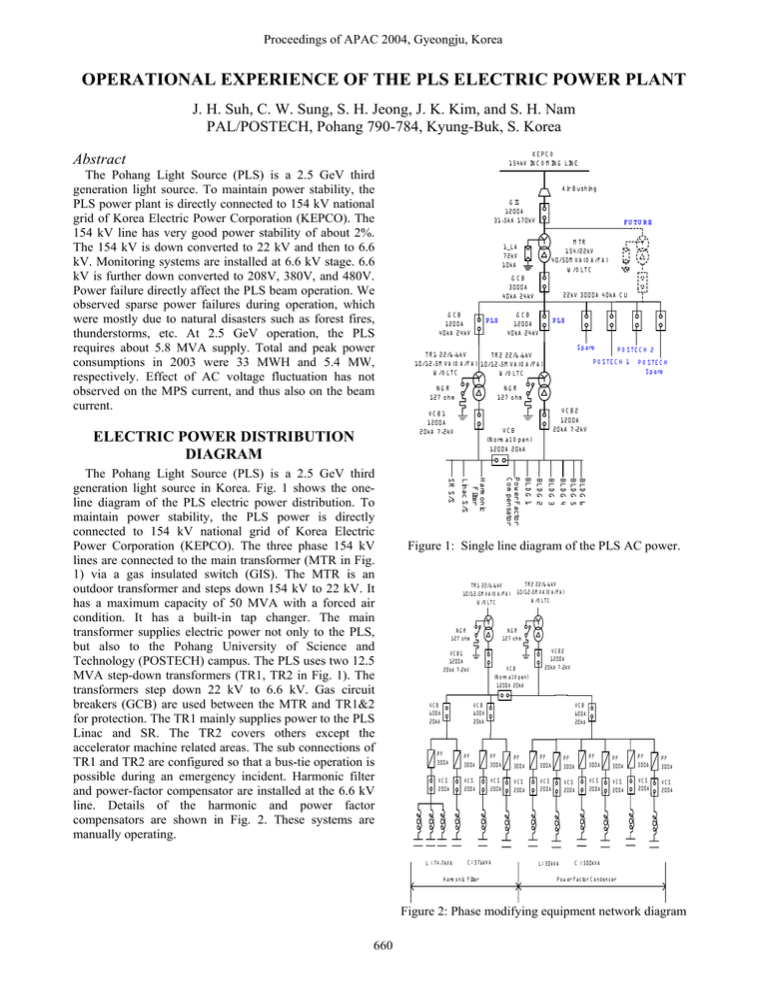
Proceedings of APAC 2004, Gyeongju, Korea OPERATIONAL EXPERIENCE OF THE PLS ELECTRIC POWER PLANT J. H. Suh, C. W. Sung, S. H. Jeong, J. K. Kim, and S. H. Nam PAL/POSTECH, Pohang 790-784, Kyung-Buk, S. Korea K EP C O 154kV IN C O M IN G LIN E Abstract The Pohang Light Source (PLS) is a 2.5 GeV third generation light source. To maintain power stability, the PLS power plant is directly connected to 154 kV national grid of Korea Electric Power Corporation (KEPCO). The 154 kV line has very good power stability of about 2%. The 154 kV is down converted to 22 kV and then to 6.6 kV. Monitoring systems are installed at 6.6 kV stage. 6.6 kV is further down converted to 208V, 380V, and 480V. Power failure directly affect the PLS beam operation. We observed sparse power failures during operation, which were mostly due to natural disasters such as forest fires, thunderstorms, etc. At 2.5 GeV operation, the PLS requires about 5.8 MVA supply. Total and peak power consumptions in 2003 were 33 MWH and 5.4 MW, respectively. Effect of AC voltage fluctuation has not observed on the MPS current, and thus also on the beam current. ELECTRIC POWER DISTRIBUTION DIAGRAM F U TU R E M TR 154/22kV 40/50M VA (O A /FA ) W /O LTC 1_LA 72kV 10kA GCB 3000A 40kA 24kV GCB 1200A 40kA 24kV P LS 22kV 3000A 40kA C U GCB 1200A 40kA 24kV P LS Spare TR 1 22/6.6kV TR 2 22/6.6kV 10/12.5M VA (O A /FA ) 10/12.5M VA (O A /FA ) W /O LTC W /O LTC P O STEC H 2 P O S TEC H 1 P O STEC H Spare NG R 127 ohm NG R 127 ohm VC B 1 1200A 20kA 7.2kV VC B 2 1200A 20kA 7.2kV VC B (N orm al O pen) 1200A 20kA BLD G BLD G BLD G BLD G 6 5 4 3 BLD G 2 BLD G 1 Pow er Factor C om pensator H arm onic Filter Linac S/S SR S/S The Pohang Light Source (PLS) is a 2.5 GeV third generation light source in Korea. Fig. 1 shows the oneline diagram of the PLS electric power distribution. To maintain power stability, the PLS power is directly connected to 154 kV national grid of Korea Electric Power Corporation (KEPCO). The three phase 154 kV lines are connected to the main transformer (MTR in Fig. 1) via a gas insulated switch (GIS). The MTR is an outdoor transformer and steps down 154 kV to 22 kV. It has a maximum capacity of 50 MVA with a forced air condition. It has a built-in tap changer. The main transformer supplies electric power not only to the PLS, but also to the Pohang University of Science and Technology (POSTECH) campus. The PLS uses two 12.5 MVA step-down transformers (TR1, TR2 in Fig. 1). The transformers step down 22 kV to 6.6 kV. Gas circuit breakers (GCB) are used between the MTR and TR1&2 for protection. The TR1 mainly supplies power to the PLS Linac and SR. The TR2 covers others except the accelerator machine related areas. The sub connections of TR1 and TR2 are configured so that a bus-tie operation is possible during an emergency incident. Harmonic filter and power-factor compensator are installed at the 6.6 kV line. Details of the harmonic and power factor compensators are shown in Fig. 2. These systems are manually operating. A ir B ushing G IS 1200A 31.5kA 170kV Figure 1: Single line diagram of the PLS AC power. TR 2 22/6.6kV TR 1 22/6.6kV 10/12.5M VA (O A /FA ) 10/12.5M VA (O A /FA ) W /O LTC W /O LTC NG R 127 ohm NG R 127 ohm VC B 1 1200A 20kA 7.2kV VC B 600A 20kA VC B (N orm al O pen) 1200A 20kA VC B 2 1200A 20kA 7.2kV VC B 600A 20kA VC B 600A 20kA PF 300A PF 300A PF 300A PF 300A PF 300A PF 300A PF 300A PF 300A PF 300A PF 300A VC S 200A VC S 200A VC S 200A VC S 200A VC S 200A VC S 200A VC S 200A VC S 200A VC S 200A VC S 200A L : 74.7kVA C : 576kVA H arm onic Filter L: 30kVA C : 500kVA P ow er Factor C ondencer Figure 2: Phase modifying equipment network diagram 660 Proceedings of APAC 2004, Gyeongju, Korea 6.6 KV POWER MONITORING UTILITY We continuously monitor voltage and current status of 6.6 kV lines. Typical voltage stability of KEPCO lines is better than 2 %. Fig. 3 shows a schematic diagram of the power monitoring utility. The monitored data are transferred to the control room via Ethernet. Fig. 4 shows a detected sample graph of a instantaneous phase-to-phase voltage sag. The top graph shows a voltage signal in short time scale, while the bottom shows a long time scale graph. The monitored data are used for tracking of power failures that cause beam dump. The power failure case shown in Fig. 4 actually resulted in beam dump. Table 1 shows the yearly accumulated power failure statistics. The main causes of power failure of KEPCO national power grid were due mostly to natural disasters such as forest fires, thunderstorms, etc. Power qualities such as total harmonic distortions (THD) are also measured periodically. Table 2 shows the THD measured at the transformers TR1 and TR2 at 2.5 GeV operation. GCB 1200A 40kA 24kV P LS Table 3 shows yearly lists of the machine operation hour, total consumed power, and peak power of the PLS from 1998 to 2003. The total power heavily depends on the operation hour. In average, 5.84 kW is consumed for one hour operation of the PLS. As the operation hour has increased, the total power consumption has also increased. Total 32.3 MWH was consumed in 2003. The peak power usually appears during hot summer season that typically ranges from July to September in Korea. Considering the peak power consumption, the PLS needs about 5.8 MVA power utility supply. From 2003, the operation mode has been changed so that we could have one 8-week long shutdown during the summer season, instead of having two 4-week long shutdowns at winter and summer seasons. Table 4 lists monthly-consumed total power and peak power in 2003. Table 5 shows an example of electric power consumption per devices. Large portions of electric power is consumed by LCW utility, magnet power supplies (MPS), and storage ring RF, and linac modulators. VC B 1 1200A 20kA 7.2kV PT 6.6kV /110V CT 400A /5A Table 2: THD of TR1&2 (22 kV/ 6.6 kV Transformer) V harmonics (%) I harmonics (%) Order TR 1 TR 2 TR 1 TR 2 3-th 0.61 0.68 0.97 0.88 5-th 1.1 0.98 9.83 7.7 7-th 0.16 0.25 1.52 2.49 9-th 0.19 0.18 0.19 0.13 11-th 0.33 0.29 0.67 1.76 THD 1.058 1.704 10.71 9.144 POWER CONSUMPTION OF THE PLS TR 1 22/6.6kV 10/12.5M V A (O A /FA ) W /O LTC NG R 127 o hm Table 1 Yearly power failure statistics Number Remark 1 1 9 Forest fire (6), thunderbolt (2), etc (1) 2001 2 2002 1 2003 2 Year 1998 1999 2000 P o w er M o nitering S ystem E therN et Figure 3: Power monitoring network diagram of 6.6 kV electric powers. Table 3: PLS operation hours and power consumption. Peak Power Year Operation Total P Hour [MWH] P [kW] Month 1998 4773 26.034 5396 Oct. 1999 4812 28.486 5380 Sept. 2000 4774 28.718 5404 Sept. 2001 4995 29.659 5316 July 2002 5520 31.186 5476 July 2003 5357 32.286 5424 March Figure 4: A sample graph captured at the instantaneous voltage sag. 661 Proceedings of APAC 2004, Gyeongju, Korea results of AC input voltage fluctuation, MPS current stability, and temperature change. The plots from the top in Fig. 5 are for Q5 MPS current, bending MPS current, MPS room temperature, and AC input voltage. During the measurement period, the Q5 MPS shows ±30ppm stability, while the bending MPS has ±15ppm. The MPS room temperature and the AC input voltage fluctuates 1.5°C and 2 %, respectively. From the plots, we could not see clear relations between current, room temperature, and AC input voltage fluctuations. Table 4: Monthly total and peak power in 2003. Month Total P [MWH] Peak Power [kW] 1 2105 4772 2 2395 4356 3 3617 4836 4 2949 5424 5 2427 4344 6 3361 5360 7 2469 3508 8 902 1972 9 2492 3960 10 3248 5100 11 3362 5064 12 2962 5000 Table 5: Power consumption at devices in 2.5 GeV Item Power (kW) % LCW, Cooler 1200 23.9 MPS 1030 20.5 RF 584 11.6 Modulator 510 10.2 Pump, Fan 402 8.01 SR Air conditioner, Light 360 7.17 Linac 302 6.02 Air conditioner, Light, Pump SR & Linac LAB 224 4.46 BLDG 1 200 3.99 BLDG 2 150 2.99 Inject 35 0.7 Linac control 13 0.26 BLDG 3 6 0.12 SR Control 2 0.04 Total 5018 100 Figure 5: AC Voltage and MPS current stability CONCLUSION EFFECT OF AC INPUT VOLTAGE FLUCTUATION ON MPS Most sensitive device for the AC input voltage fluctuation is the storage ring MPS. If the MPS affects by the AC fluctuation, the stored beam will also fluctuate. Therefore, it is important to maintain the MPS output current stability requirement regardless of the AC input voltage fluctuation. Fig. 5 shows 4-hour measurement 662 The PLS power is directly supplied from the 154 kV national power grid that is maintained by KEPCO. The 154 kV line has very good power stability of about 2%. The good power stability helps to operate the PLS in stable mode. We observed sparse power failures during operation, which were mostly due to natural disasters such as forest fires, thunderstorms, etc. At 2.5 GeV operation, the PLS requires about 5.8 MVA supply. Total and peak power consumption in 2003 were 33 MWH and 5.4 MW, respectively. During the PLS operation, most of power was consumed by LCW utility, MPS, storage ring RF, and linac modulators. Measurement results show that AC voltage fluctuation of 2% does not affect the MPS stability.


