3D Stray Field Analysis of Transformer Cores Considering DC-bias
advertisement

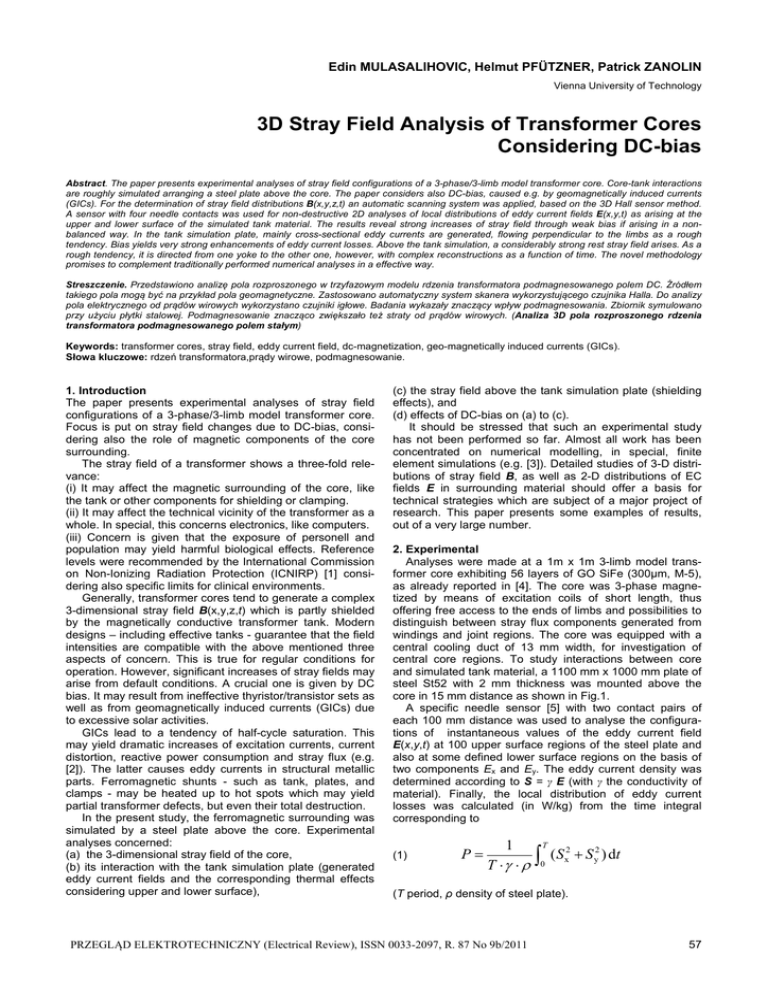
Edin MULASALIHOVIC, Helmut PFÜTZNER, Patrick ZANOLIN Vienna University of Technology 3D Stray Field Analysis of Transformer Cores Considering DC-bias Abstract. The paper presents experimental analyses of stray field configurations of a 3-phase/3-limb model transformer core. Core-tank interactions are roughly simulated arranging a steel plate above the core. The paper considers also DC-bias, caused e.g. by geomagnetically induced currents (GICs). For the determination of stray field distributions B(x,y,z,t) an automatic scanning system was applied, based on the 3D Hall sensor method. A sensor with four needle contacts was used for non-destructive 2D analyses of local distributions of eddy current fields E(x,y,t) as arising at the upper and lower surface of the simulated tank material. The results reveal strong increases of stray field through weak bias if arising in a nonbalanced way. In the tank simulation plate, mainly cross-sectional eddy currents are generated, flowing perpendicular to the limbs as a rough tendency. Bias yields very strong enhancements of eddy current losses. Above the tank simulation, a considerably strong rest stray field arises. As a rough tendency, it is directed from one yoke to the other one, however, with complex reconstructions as a function of time. The novel methodology promises to complement traditionally performed numerical analyses in a effective way. Streszczenie. Przedstawiono analizę pola rozproszonego w trzyfazowym modelu rdzenia transformatora podmagnesowanego polem DC. Źródłem takiego pola mogą być na przykład pola geomagnetyczne. Zastosowano automatyczny system skanera wykorzystującego czujnika Halla. Do analizy pola elektrycznego od prądów wirowych wykorzystano czujniki igłowe. Badania wykazały znaczący wpływ podmagnesowania. Zbiornik symulowano przy użyciu płytki stalowej. Podmagnesowanie znacząco zwiększało też straty od prądów wirowych. (Analiza 3D pola rozproszonego rdzenia transformatora podmagnesowanego polem stałym) Keywords: transformer cores, stray field, eddy current field, dc-magnetization, geo-magnetically induced currents (GICs). Słowa kluczowe: rdzeń transformatora,prądy wirowe, podmagnesowanie. 1. Introduction The paper presents experimental analyses of stray field configurations of a 3-phase/3-limb model transformer core. Focus is put on stray field changes due to DC-bias, considering also the role of magnetic components of the core surrounding. The stray field of a transformer shows a three-fold relevance: (i) It may affect the magnetic surrounding of the core, like the tank or other components for shielding or clamping. (ii) It may affect the technical vicinity of the transformer as a whole. In special, this concerns electronics, like computers. (iii) Concern is given that the exposure of personell and population may yield harmful biological effects. Reference levels were recommended by the International Commission on Non-Ionizing Radiation Protection (ICNIRP) [1] considering also specific limits for clinical environments. Generally, transformer cores tend to generate a complex 3-dimensional stray field B(x,y,z,t) which is partly shielded by the magnetically conductive transformer tank. Modern designs – including effective tanks - guarantee that the field intensities are compatible with the above mentioned three aspects of concern. This is true for regular conditions for operation. However, significant increases of stray fields may arise from default conditions. A crucial one is given by DC bias. It may result from ineffective thyristor/transistor sets as well as from geomagnetically induced currents (GICs) due to excessive solar activities. GICs lead to a tendency of half-cycle saturation. This may yield dramatic increases of excitation currents, current distortion, reactive power consumption and stray flux (e.g. [2]). The latter causes eddy currents in structural metallic parts. Ferromagnetic shunts - such as tank, plates, and clamps - may be heated up to hot spots which may yield partial transformer defects, but even their total destruction. In the present study, the ferromagnetic surrounding was simulated by a steel plate above the core. Experimental analyses concerned: (a) the 3-dimensional stray field of the core, (b) its interaction with the tank simulation plate (generated eddy current fields and the corresponding thermal effects considering upper and lower surface), (c) the stray field above the tank simulation plate (shielding effects), and (d) effects of DC-bias on (a) to (c). It should be stressed that such an experimental study has not been performed so far. Almost all work has been concentrated on numerical modelling, in special, finite element simulations (e.g. [3]). Detailed studies of 3-D distributions of stray field B, as well as 2-D distributions of EC fields E in surrounding material should offer a basis for technical strategies which are subject of a major project of research. This paper presents some examples of results, out of a very large number. 2. Experimental Analyses were made at a 1m x 1m 3-limb model transformer core exhibiting 56 layers of GO SiFe (300μm, M-5), as already reported in [4]. The core was 3-phase magnetized by means of excitation coils of short length, thus offering free access to the ends of limbs and possibilities to distinguish between stray flux components generated from windings and joint regions. The core was equipped with a central cooling duct of 13 mm width, for investigation of central core regions. To study interactions between core and simulated tank material, a 1100 mm x 1000 mm plate of steel St52 with 2 mm thickness was mounted above the core in 15 mm distance as shown in Fig.1. A specific needle sensor [5] with two contact pairs of each 100 mm distance was used to analyse the configurations of instantaneous values of the eddy current field E(x,y,t) at 100 upper surface regions of the steel plate and also at some defined lower surface regions on the basis of two components Ex and Ey. The eddy current density was determined according to S = γ E (with γ the conductivity of material). Finally, the local distribution of eddy current losses was calculated (in W/kg) from the time integral corresponding to (1) P 1 T T 0 ( S x2 S y2 ) dt (T period, ρ density of steel plate). PRZEGLĄD ELEKTROTECHNICZNY (Electrical Review), ISSN 0033-2097, R. 87 No 9b/2011 57 was related to the AC-current peak value for mere ACmagnetization according to a DC-ratio xyz-movement apparatus (2) 3D-hall sensor needle sensor tank simulation plate 1,1 m 1m z y x transformer core s = 15 mm cooling duct Fig.1 Photograph of the complete test system. Including: simulated tank material - a 1100 mm x 1000 mm x 2 mm steel plate (St52) - arranged above a 3-phase/3limb model transformer core in an automatic scanning system, equipped with a 3D hall sensor. The scanning chamber dimensions: 1.5m x 1.4m x 1m. measuring position 25 mm x 200 400 S-Coil y rDC = IDC / iAC,p-p(IDC=0) . DC-components were impressed as well in a balanced way (in the same order for all three limbs) as in an unbalanced way (either for R-limb, S-limb or T-limb). 3. Stray field of the mere core As a starting point, Fig.2 illustrates the stray field of the mere core without tank simulation for distances up to about 40 mm from the surface. The profile concerns the y/zcomponent Byz for the S-limb section between the yoke and the coil end (Fig.2a), in some distance from the limb axis. The weak x-component was neglected. Fig.2b shows the undisturbed, mere 3-phase ACmagnetization case. The field “emerges” from the surface, the left part flowing to the yoke edge, the right one crossing over the magnetization coil. The mean field intensity proved to be close to 0,9 mT with maxima up to 1,5 mT. Fig.2c shows the case of unbalanced DC of rDC = 4 in the S-limb. It yielded an increase of intensities by about a factor 4, with a mean field intensity of almost 3,6 mT and maximum field intensity up to 6 mT. Generally, the profiles indicate that the field intensity decreases strongly with increasing distance from the core surface, the loss being of the order of 50% for 20 mm distance. (a) mean value 0,9 [mT] z [mm] 30 20 10 0 (b) mean value 3,6 [mT] z [mm] 30 20 10 0 (c) 200 220 240 260 280 300 y [mm] 320 340 360 380 400 Fig.2. Stray field Byz over the S-limb (without tank simulation plate) as detected over the free S-limb end (about 25 mm from the window). The peak-to-peak field intensity is coded through the bar thickness. (a) Mere 3-phase AC excitation. (b) AC plus unbalanced DC in the S-limb. The stray field B(x,y,z,t) above the mere core and above the tank simulation plate, respectively, was measured with a 3D hall sensor system in an automatic scanning chamber [6] for 20 instants of time during the period. A scanning step size of about 50 mm for both x and y-direction results in 360 local regions of a plane which yielded a total procedure time of about 10 hours. This is acceptable with regard to an unsupervised automatic scanning process. The instantaneous stray field vector B was calculated from its three components. Systematic comparisons were made between mere ACmagnetization (1,7 T; 50 Hz) and the case of additional DCmagnetization. The order IDC of DC-magnetization current 58 4. Eddy current field in the tank simulation plate Arrangement of the tank simulation plate above the core yields distinct changes of the stray above the core, i.e. between its surface and the plate. But so far, this field was not studied in detail since automatic scanning is not possible. The stray field gets into interaction with the plate, generating an eddy current field E(x,y,z,t) in it - and partly it penetrates the plate. So far analyses were focussed on the easy-to-analyse field E1 of the upper plate surface, apart from some pilot measurements of the field E2 of the lower one. Out of a high number of measured profiles E1(x,y,t), Fig.3a shows the case of mere 3-phase magnetization for the instant of time when the R-limb exhibits maximum induction. The field emerges in a concentrated way from the region A in the centre of the left plate edge, over the R-limb. In a somehow radial way, it distributes towards the S-limb. Then it “disappears” in a gradual way in region B, obviously flowing through the plate to its lower surface. The corresponding field E2 can be assumed to stream back to the left plate centre in a similar planar distribution, however, with higher intensity. As an interpretation, the stray field B enters in the plate over the lower yoke and leaves it at the higher one. Analogous eddy field distributions can be observed to emerge from the right plate edge centre (region C), however, as to be expected, with low intensity at the given instant of time. Fig.3b shows the case of unbalanced DC-bias of the Tlimb for the instant of maximum induction in it. Here, a distinct field concentration is given in the right region C. Throughout the plate surface, the field is directed to it contrary to the mere AC case - also in the R-limb vicinity. While the maximum intensity of E1 is close to 50 mV/m for the mere AC-case (Fig.3a), it now is close to 500 mV/m. This means that the DC bias yields 10-fold intensities. Fig.4 shows a comparison of E1 of the upper plate surface with E2 of the lower one. For a peripheral R-limb region, the computer display compares time dependencies for unbalanced DC-bias in the T-limb. Almost not any differences are given for the x-components, apart from a PRZEGLĄD ELEKTROTECHNICZNY (Electrical Review), ISSN 0033-2097, R. 87 No 9b/2011 phase shift. However, compared to the lower one, the ycomponent of the upper surface is distinctly weaker, by about 40%, corresponding to a distinct effect of shielding. Due to the quadratic relationship (equ.1), the eddy current loss is strongly reduced, from about 5 W/kg to about 2,6 W/kg. AC T AC S AC R 1 mT S R T z y x (a) AC+DC A B C T AC+DC AC+DC S R y 50 mV/m x 1 mT simulation plate (a) y z x (b) AC S R T S AC A C R y y T AC+DC 1 mT z x (c) x 500 mV/m AC simulation plate (b) T AC Fig.3.2. Distribution of eddy current field E1 on the upper surface of the tank simulation plate, as arranged above the core. (a) Mere AC excitation, for the instant of maximum magnetization of the R-limb. (b) AC plus DC-magnetization in the Tlimb for the instant of maximum magnetization in the T-limb. E1,x E1,y spot E2,x E2,y Fig.4. Example of an instantaneous on-screen display offering data on local eddy current field components E1,x and E1,y of the upper surface of the tank simulation plate and E2,x and E2,y of the lower surface. AC-magnetization was combined with DC excitation in the outer T-limb. The spot of needle position, for both upper and lower needle sensor, is indicated in red colour. S AC+DC R y z 1 mT x (d) Fig.5. 3-D distribution of stray field B over the tank simulation plate as arranged above the core. (a) Mere 3-phase AC magnetization, for the instant of maximum T-limb magnetization. (b) 3-phase AC magnetization and balanced DC, for the instant of maximum Tlimb magnetization. (c) 3-phase AC magnetization and unbalanced DC in the central S-limb, for in the instant of maximum S-limb magnetization. (d) 3-phase AC magnetization and unbalanced DC in the R-limb, for the instant of maximum R-limb magnetization, a case which is characterized by the "far-off effect", i.e. maximum field enhancement not in the R-limb but in the T-limb. 5. Stray field above the tank simulation plate Out of a very high number of established profiles, the examples of Fig. 5 show distributions of the instantaneous 3-D stray field B as detected in some mm distance above the steel plate surface. Fig.5a depicts the case of mere 3phase AC-magnetization for the instant of time of maximum flux in the T-limb. The major stray flux emerges from the lower yoke in the vicinity of the T-limb and re-enters in the upper one, the maximum intensities being close to 0,4 mT. This means that the excitation coil is bridged in direction y with distinctly reduced field intensity. As to be expected, PRZEGLĄD ELEKTROTECHNICZNY (Electrical Review), ISSN 0033-2097, R. 87 No 9b/2011 59 generally lower intensities arise for the S-limb vicinity, with flux in direction y, and in the R-limb vicinity with flux in direction –y. This is corresponding to the instantaneous AC excitations of the three limbs. Additional, balanced DC-magnetizaton of rDC = 4 (Fig.5b) yields an increase of field intensity by roughly 100%. It is linked with an asymmetric over-all configuration. This is due to the fact that DC-components are included now. In the given case, the lower yoke becomes predominant so that all three coils are bridged in direction y. Fig.5c shows results for combined AC/DC-magnetization – unbalanced DC impressed to the central S-limb – for the instant of time of maximum flux in the S-limb. In the depicted instant, the major stray flux emerges from the upper yoke and re-enters in the lower one. In comparison with the mere AC case according to Fig.5a, strong field increases of up to more than 300% arise. Apart from a rather small portion of DC-field, this strong increase can be attributed to distinctly enhanced peak values of AC excitation as being typical for unbalanced bias. Analogous effects arise for unbalanced bias in the R-limb (Fig.5d) with maximum field increases over the T-limb (a phenomenon entitled as “far-off effect” in earllier work). 6. Discussion and conclusions The traditional way to simulate stray fields of transformer cores is to apply numerical modeling, in most cases the use of the finite element method. However, severe limitations result from the high anisotropy of modern core materials in connection with strong non-linearity. Considering DC-bias enhances the problem since involving asymmetric processes of magnetization. The above means that experimental simulation becomes a most attractive alternative, though causing very high expenditure. Here an approach was made by applying a scanning chamber for the automatic determination of 3dimensional stray flux distributions. Of course, limitations exist also here, in special since the sensor head cannot be moved to all locations of interest. In the present work, it was not possible to analyze the field between core surface and the tank simulation plate. But the results from the plate and from the space above it yield indirect informations. In special, the data indicates that unbalanced DC-bias tends to cause distinct field increases throughout the system. A second experimental approach was performed with respect to the well known needle method. So far, its use was restricted to analyses of core material. Now it proved to 60 be an effective tool to investigate eddy current distributions of magnetic components of the core surrounding, in special of simulated tank material. The results allow easy estimations of local eddy current losses. DC-bias proves to yield strong increases. In practice, this tendency was responsible for the thermal destruction of transformers as e.g. reported in [2]. In current work, more realistic closed tank arrangements are being studied in order to approach practical conditions. Finally, attempts will be made to apply the modified needle method at tank walls of industrially manufactured machines. Acknowledgements The authors acknowledge support from the Austrian Science Funds FWF (Project No. P 21546-N22), from ABB Transformers Ludvika (Sweden), as well as from the Vienna Magnetics Group. REFERENCES [1] Guidelines for limiting exposure to time-varying electric, magnetic and electromagnetic fields (up to 300 GHz) International Commission on Non-Ionizing Radiation Protection. Health Phys. 54 (1998), 115-123 [2] Molinski T.S., Why utilities respect geomagnetically induced currents, J.Atm. & Solar-Terrestr. Phys. 64 (2002), 1765-1778 [3] S.Lu, Y.Liu, FEM analysis of DC saturation to assess transformer susceptibility to geomagnetically induced currents, IEEE Trans.Power Deliv. 8 (1993), 1367 [4] E. Mulasalihovic, H. Pfützner, P. Zanolin, Complete surface analysis of model transformer core considering dc-magnetization components, El.Rev.(Prz.Elektrot.) 85 (2009), 43-46 [5] Pfützner H., Krismanic G., The needle method for induction tests - sources of error, IEEE Trans.Nagn.40 (2004),1610-1616 [6] G.Krismanic, E.Leiss, S.Barsoum, H.Pfützner, Automatic scanning system for the determination of local loss distributions in magnetic cores, J.Magn.Magn.Mater. 254-255 (2003), 60-63 Authors: DI Edin Mulasalihovic, mulasalihovic@tuwien.ac.at; Prof. Helmut Pfützner, pfutzner@tuwien.ac.at; Patrick Zanolin, patrick.zanolin@gmx.at. All: Vienna University of Technology, Institute of Electrodynamics, Microwave and Circuit Engineering, Gusshausstr. 27, A-1040 Vienna, Austria PRZEGLĄD ELEKTROTECHNICZNY (Electrical Review), ISSN 0033-2097, R. 87 No 9b/2011


