System metric for holographic memory systems
advertisement
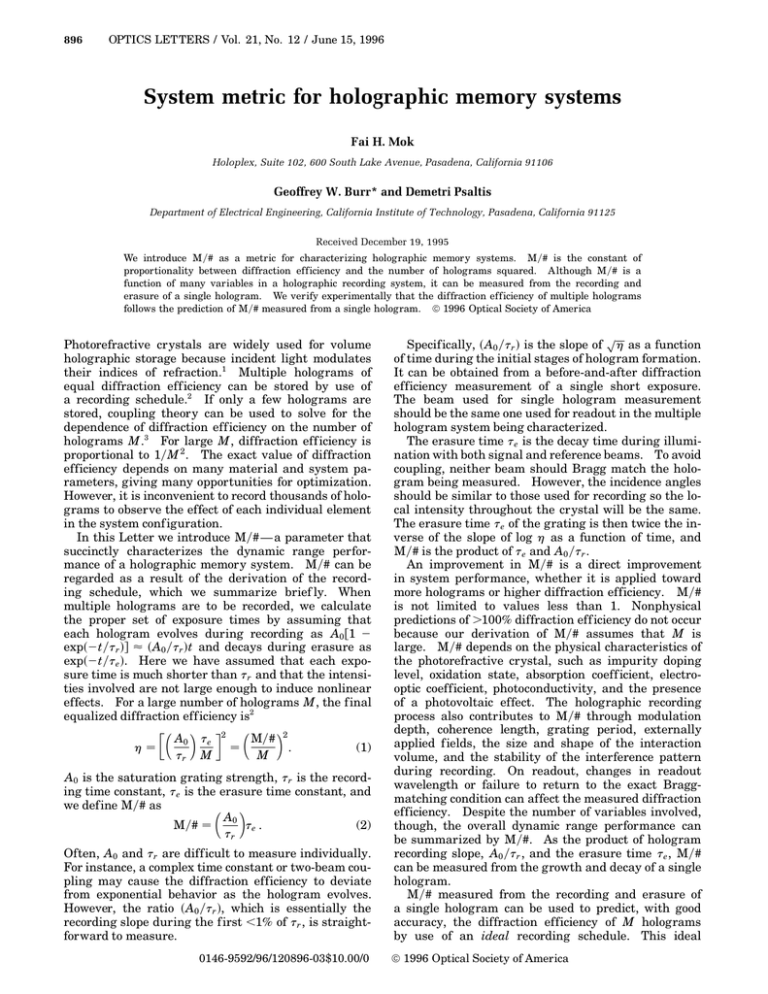
896 OPTICS LETTERS / Vol. 21, No. 12 / June 15, 1996 System metric for holographic memory systems Fai H. Mok Holoplex, Suite 102, 600 South Lake Avenue, Pasadena, California 91106 Geoffrey W. Burr* and Demetri Psaltis Department of Electrical Engineering, California Institute of Technology, Pasadena, California 91125 Received December 19, 1995 We introduce My# as a metric for characterizing holographic memory systems. My# is the constant of proportionality between diffraction efficiency and the number of holograms squared. Although My# is a function of many variables in a holographic recording system, it can be measured from the recording and erasure of a single hologram. We verify experimentally that the diffraction efficiency of multiple holograms follows the prediction of My# measured from a single hologram. 1996 Optical Society of America Photorefractive crystals are widely used for volume holographic storage because incident light modulates their indices of refraction.1 Multiple holograms of equal diffraction eff iciency can be stored by use of a recording schedule.2 If only a few holograms are stored, coupling theory can be used to solve for the dependence of diffraction eff iciency on the number of holograms M.3 For large M, diffraction eff iciency is proportional to 1yM 2 . The exact value of diffraction efficiency depends on many material and system parameters, giving many opportunities for optimization. However, it is inconvenient to record thousands of holograms to observe the effect of each individual element in the system conf iguration. In this Letter we introduce My#— a parameter that succinctly characterizes the dynamic range performance of a holographic memory system. My# can be regarded as a result of the derivation of the recording schedule, which we summarize brief ly. When multiple holograms are to be recorded, we calculate the proper set of exposure times by assuming that each hologram evolves during recording as A0 f1 2 exps2tytr dg ø sA0 ytr dt and decays during erasure as exps2tyte d. Here we have assumed that each exposure time is much shorter than tr and that the intensities involved are not large enough to induce nonlinear effects. For a large number of holograms M, the f inal equalized diffraction eff iciency is2 ∑µ ∂ ∏2 µ ∂ A0 te My# 2 h­ ­ . (1) tr M M A0 is the saturation grating strength, tr is the recording time constant, te is the erasure time constant, and we def ine My# as µ ∂ A0 te . (2) My# ­ tr Often, A0 and tr are difficult to measure individually. For instance, a complex time constant or two-beam coupling may cause the diffraction efficiency to deviate from exponential behavior as the hologram evolves. However, the ratio sA0 ytr d, which is essentially the recording slope during the f irst ,1% of tr , is straightforward to measure. 0146-9592/96/120896-03$10.00/0 p Specifically, sA0 ytr d is the slope of h as a function of time during the initial stages of hologram formation. It can be obtained from a before-and-after diffraction efficiency measurement of a single short exposure. The beam used for single hologram measurement should be the same one used for readout in the multiple hologram system being characterized. The erasure time te is the decay time during illumination with both signal and reference beams. To avoid coupling, neither beam should Bragg match the hologram being measured. However, the incidence angles should be similar to those used for recording so the local intensity throughout the crystal will be the same. The erasure time te of the grating is then twice the inverse of the slope of log h as a function of time, and My# is the product of te and A0 ytr . An improvement in My# is a direct improvement in system performance, whether it is applied toward more holograms or higher diffraction efficiency. My# is not limited to values less than 1. Nonphysical predictions of .100% diffraction eff iciency do not occur because our derivation of My# assumes that M is large. My# depends on the physical characteristics of the photorefractive crystal, such as impurity doping level, oxidation state, absorption coeff icient, electrooptic coefficient, photoconductivity, and the presence of a photovoltaic effect. The holographic recording process also contributes to My# through modulation depth, coherence length, grating period, externally applied f ields, the size and shape of the interaction volume, and the stability of the interference pattern during recording. On readout, changes in readout wavelength or failure to return to the exact Braggmatching condition can affect the measured diffraction efficiency. Despite the number of variables involved, though, the overall dynamic range performance can be summarized by My#. As the product of hologram recording slope, A0 ytr , and the erasure time te , My# can be measured from the growth and decay of a single hologram. My# measured from the recording and erasure of a single hologram can be used to predict, with good accuracy, the diffraction efficiency of M holograms by use of an ideal recording schedule. This ideal 1996 Optical Society of America June 15, 1996 / Vol. 21, No. 12 / OPTICS LETTERS recording schedule has a f inal exposure of length te yM but an inf initely long initial exposure. Any practical initial exposure implies that the final exposure is some fraction f of te yM. After a recording schedule with such a f inal exposure is used, all M holograms will be equalized in diffraction eff iciency to h ­ f 2 sMy#yMd2 . An equivalent way of thinking of this is that an ideal exposure schedule for M 1 X holograms was formulated but that the f irst X holograms were skipped and recording started with exposure X 1 1. X, the number of skipped holograms, and f , the fraction of My# that is used, are related by f ­ MysM 1 Xd. The relationship between X and f is plotted in Fig. 1 for M ­ 1000 holograms. The parameter f (or, equivalently, X) is useful because it permits control over the average recording time (for a given intensity). Proper choice of the parameter f can reduce the total recording time to practical values with a moderate sacrifice of diffraction eff iciency. Indeed, f can be considered the fraction of My# used. Figure 2 shows the relationship between the average recording time and f for storage of 1000 holograms. Note that using the last few percent of dynamic range is very costly in terms of recording time. Conventionally, the exposure schedule is calculated by a forward recursion algorithm: an initial time is chosen, and recording times are calculated up to the Mth exposure. Knowledge of both the recording and the erasure time constants is required. Because the recording time constant cannot be measured reliably, the only way to find it is by trial and error. Instead, we can use a simpler backward-recursion algorithm, which permits explicit selection of the fraction f and does not require knowledge of the recording time constant. We summarize the algorithm as follows: given the measured erasure time constant te and the desired number of holograms M, the last exposure is chosen to be tM ­ f te yM . We calculate previous exposure times recursively, using the expression tm21 ­ tm expstm yte d , 897 measurement. We derived recording schedules for 100, 200, 400, and 1000 holograms, using f ­ 0.8 and f ­ 0.6. After a set of multiple holograms was recorded, we measured the diffraction efficiency by sampling a subset of 20 well-distributed holograms. Figure 3 is a log– log plot of the average diffraction efficiency as a function of the number of holograms. As expected, the data follow a 1yM 2 relationship. We compute My# by dividing the intercepts of the fitted 1yM 2 curves by f 2; the result is shown in Table 1. The results show that My# measured from a single hologram is a good indicator of the diffraction efficiency of multiple holograms. The observed trend of a lower My# for a higher value of f stems from two second-order effects. High values of f lead to schedules in which both the initial exposures and the Fig. 1. Number of holograms discarded from recording schedule versus fraction f of My# used, for storage of 1000 holograms. (3) until the f irst recording time t1 . This initial exposure, and the whole recording sequence, will be f inite if f , 1. We perform experimental measurements to compare My# from a single hologram measurement with the diffraction efficiency of multiple holograms. We used a 2 cm 3 1.5 cm 3 1 cm LiNbO3 crystal with 0.01% Fe doping from Deltronics Crystals. We recorded holograms in the 90± geometry, using equal irradiance plane-wave reference and signal beams at 488 nm. A small rectangular portion of a large volume grating was sampled by a weak plane-wave readout beam. My# was measured from the recording and erasure of single holograms. The average and the standard deviation of My# are shown in the first row of Table 1. The erasure time constant was measured during exposure with both the reference and the signal beams, with the crystal and reference beams rotated to avoid coupling with the original grating during erasure. We used the same experimental setup to store multiple holograms. The erasure time constant of 540 s was taken from the results of single hologram Fig. 2. Average recording time versus fraction f of My# used. Table 1. Experimentally Measured My# Experiment My# Single hologram recording/erasure Multiple holograms, f ­ 0.8 Multiple holograms, f ­ 0.6 1.368 6 0.061 1.256 1.492 898 OPTICS LETTERS / Vol. 21, No. 12 / June 15, 1996 holograms. The sum effect is a reduction in the average measured diffraction eff iciency for schedules constructed with large values of f . In conclusion, we have introduced a system metric that concisely characterizes the dynamic range performance of a holographic storage system. By def ining My# in terms of recording slope and erasure time, we can determine it from the recording and erasure of a single hologram. We have introduced a new recursion algorithm for the recording schedule that does not require knowledge of the recording behavior. This algorithm also gives explicit control over the trade-off between average recording time and diffraction efficiency. Finally, we have experimentally verified that My#, measured from the recording and erasure of a single hologram, is an accurate predictor of the diffraction efficiency of multiple holograms. Fig. 3. Diffraction eff iciency versus number of holograms stored, for f ­ 0.8 and f ­ 0.6. The f inal recording time for M holograms is tlast ­ f te yM, where te ­ 540 s. *Present address, IBM Almaden Research Center, 650 Harry Road, San Jose, California 95120. References total exposure time are long. The approximation of linear recording may not be valid during these long exposure times, leading to weaker initial holograms. The long total exposure time leads to an increase in the bulk electric f ield induced by the photovoltaic effect. This field tends to cause a slight Bragg mismatch for earlier holograms and to reduce A0 ytr for later-written 1. D. L. Staebler, J. J. Amodei, and W. Phillips, presented at the VII International Quantum Electronics Conference, Montreal, Canada, May 1972. 2. D. Psaltis, D. Brady, and K. Wagner, Appl. Opt. 27, 1752 (1988). 3. E. Maniloff and K. Johnson, J. Appl. Phys. 70, 4702 (1991).
