Energy Price Spread: Natural Gas vs. Crude Oil in the

Market nsights
FEBRUARY 6, 2014 BY SAMANTHA AZZARELLO, ECONOMIST, CME GROUP
Energy Price Spread:
Natural Gas vs. Crude Oil in the US
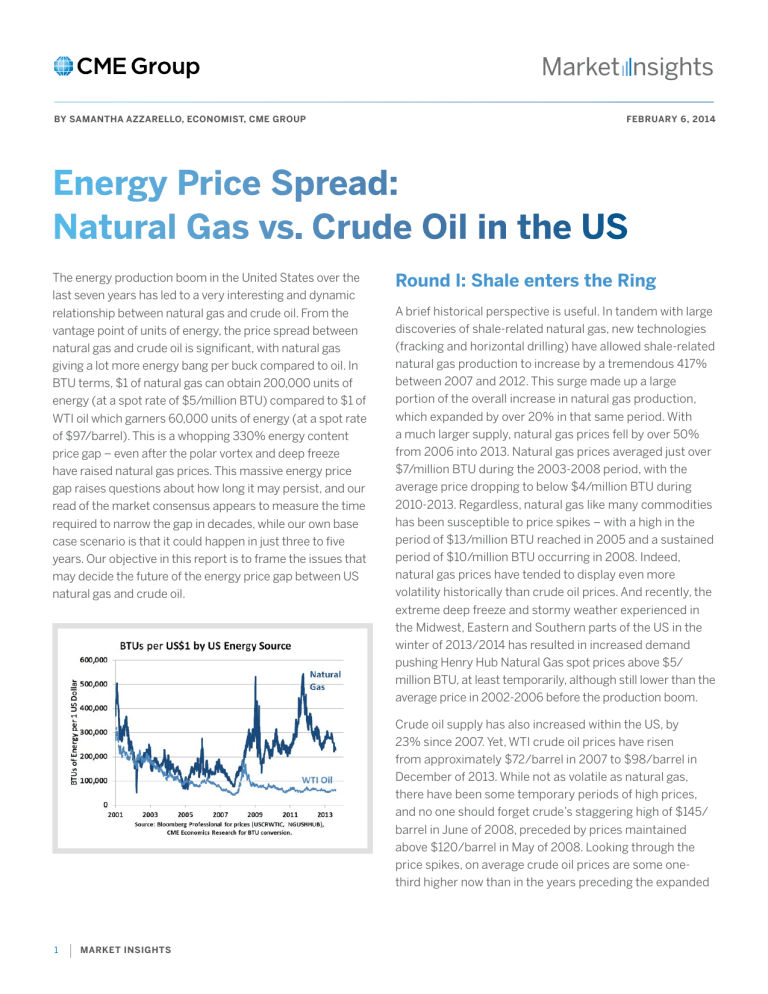
The energy production boom in the United States over the last seven years has led to a very interesting and dynamic relationship between natural gas and crude oil. From the vantage point of units of energy, the price spread between natural gas and crude oil is significant, with natural gas giving a lot more energy bang per buck compared to oil. In
BTU terms, $1 of natural gas can obtain 200,000 units of energy (at a spot rate of $5/million BTU) compared to $1 of
WTI oil which garners 60,000 units of energy (at a spot rate of $97/barrel). This is a whopping 330% energy content price gap – even after the polar vortex and deep freeze have raised natural gas prices. This massive energy price gap raises questions about how long it may persist, and our read of the market consensus appears to measure the time required to narrow the gap in decades, while our own base case scenario is that it could happen in just three to five years. Our objective in this report is to frame the issues that may decide the future of the energy price gap between US natural gas and crude oil.
Round I: Shale enters the Ring
A brief historical perspective is useful. In tandem with large discoveries of shale-related natural gas, new technologies
(fracking and horizontal drilling) have allowed shale-related natural gas production to increase by a tremendous 417% between 2007 and 2012. This surge made up a large portion of the overall increase in natural gas production, which expanded by over 20% in that same period. With a much larger supply, natural gas prices fell by over 50% from 2006 into 2013. Natural gas prices averaged just over
$7/million BTU during the 2003-2008 period, with the average price dropping to below $4/million BTU during
2010-2013. Regardless, natural gas like many commodities has been susceptible to price spikes – with a high in the period of $13/million BTU reached in 2005 and a sustained period of $10/million BTU occurring in 2008. Indeed, natural gas prices have tended to display even more volatility historically than crude oil prices. And recently, the extreme deep freeze and stormy weather experienced in the Midwest, Eastern and Southern parts of the US in the winter of 2013/2014 has resulted in increased demand pushing Henry Hub Natural Gas spot prices above $5/ million BTU, at least temporarily, although still lower than the average price in 2002-2006 before the production boom.
Crude oil supply has also increased within the US, by
23% since 2007. Yet, WTI crude oil prices have risen from approximately $72/barrel in 2007 to $98/barrel in
December of 2013. While not as volatile as natural gas, there have been some temporary periods of high prices, and no one should forget crude’s staggering high of $145/ barrel in June of 2008, preceded by prices maintained above $120/barrel in May of 2008. Looking through the price spikes, on average crude oil prices are some onethird higher now than in the years preceding the expanded
1 MARKET INSIGHTS
JANUARY 21, 2014 production in the US, with a trading range over the last
12 months of $92-$106 per barrel, displaying a tendency toward reduced volatility.
With both crude oil and natural gas production rising in the US, and despite some temporary price spikes, average natural gas prices are lower and crude oil prices higher than before the production revolution began. As noted already, this differential price behavior has resulted in the wide energy price gap, whereby natural gas provides three times the BTUs per dollar that crude oil does. As potential substitutes in some cases, and as future substitutes as technology and uses evolve, the unusual price spread patterns between the two sources of energy are likely to result in a dynamic relationship which could play out in the
US energy markets over the next 5 to 10 years.
That is, such a significant energy cost gap would logically set in motion market forces leading to a shift in usage patterns having the potential to close the spread over time. Decisions to invest and develop new or expanded uses for natural gas depend in part on whether or for how long one expects natural gas to remain the less expensive source of energy. We would note that direct competition is not a necessary condition for the price spread to close.
Before 2005, a BTU price gap did not exist, and there was little direct competition between crude oil and natural gas as sources of energy. Our perspective, however, is that structural change in the natural gas market is re-setting conditions in a way such that the energy price spread between natural gas and crude oil may close faster than expected. When two energy sources have only limited direct competition, closing the energy price gap may take decades. If natural gas and crude oil come more directly into competition with each other as sources of energy for end-users, then the energy price gap might be closed in a matter of years.
Round II: Shifting Usage Patterns
Crude oil is an energy source mainly used by only one sector. According to the US Energy Information
Administration (EIA), 71% of total crude usage in the US is related to transportation, while industrial sector uses account for approximately 20%, and power generation and commercial use is negligible. Natural gas, contrastingly, is a much more diversified energy source in terms of use.
Usage is currently split amongst the power generation, industrial, and residential/commercial end-use sectors at approximately 30% each. For our analysis, however, the sector of most interest is transportation, where natural gas usage is only a modest 3%, but growing quickly. From 2007 to 2012, natural gas consumption in the US transportation sector increased by 22%.
This report will discuss the potential interplay between natural gas and crude oil in each of the principal end-use sectors in turn, starting with where there is indirect competition (residential/commercial use and power generation), followed by some direct competition (industrial) and finally focusing on the transportation sector where there is the most potential for a direct, head on battle between the two energy sources that could profoundly influence relative price dynamics in future years in the US.
Power generation, while once heavily reliant on coal, has shifted markedly into natural gas in recent years. Natural gas usage for electric power generation increased by 33% from 2007 to 2013. This pushed more coal into exports rather than for domestic consumption. Oil has never been a viable alternative fuel for power generation, so a movement to using increased natural gas in power generation does not provide any direct competition between oil and gas, although the potential for cheaper electric prices could modestly impact oil usage in the industrial sector over time.
Furthermore, increased use of natural gas in electricity generation is being offset somewhat by the construction of new, modern plants, which are highly efficient and use less gas. On net, increased use in power generation could put upward pressure on gas prices, but is not likely to have any direct influence on oil prices.
2 MARKET INSIGHTS
JANUARY 21, 2014
Across the Industrial sector, the ability to switch between oil and natural gas varies widely between industries and manufacturing processes, between much and not at all.
There are cases, such as petrochemical manufacturing, with production formerly at an 80:20 balance of oil-based inputs to natural gas inputs, which has tipped quickly to a
50:50 balance as of 2013. But this is more the exception than the rule.
The sector where a natural gas versus crude battle can really be fought is transportation. Long dominated by oil and related refined products, natural gas is now moving into the transportation space. It is this area of potential direct competition in the transportation sector which we think has the most potential to shrink the price spread between the two energy sources in a more rapid manner than many market participants currently appreciate.
The transportation sector can be broken into passenger travel – light duty and high duty vehicles and freight travel.
Once entirely commanded by crude, natural gas in the form of liquefied natural gas (LNG) has moved into the heavy duty trucks and the long haul industry, while compressed natural gas (CNG) has moved into corporate fleets and, to a much smaller degree, passenger vehicles.
The main proponents against natural gas fueled vehicles argue nascent infrastructure as the prime impediment.
Natural gas has been a natural fit for “point-to-point” vehicles, however, with an example being a fleet which travels from NYC to Boston or Houston to Dallas on a regular basis, and “Return home vehicles”, such as bus fleets which can return to a lot equipped with refill capacity at the end of the day. As of 2012, 1 in 5 new transit buses in the US were natural gas fuelled. The viability of mass natural gas passenger vehicle growth requires a network of
CNG filling stations – which may be a long way off. But then again – it might not be so far off. Shell recently announced
100 LNG fuelling stations, and Clean Energy Fuels Corp. built 150 new LNG fuelling stations in 2012/2013.
The EIA estimates that between 2011 and 2040, natural gas usage in transportation will grow at an annual rate of 12% per year. We think this may represent a large underestimate of the growth rate and potential for natural gas to cause a major shake-up within the transportation sector. In
2013 alone, 4 large companies rolled out new 12-liter LNG engines – which are ideal for heavy duty 18 wheeler trucks.
Another prime example is the shipping industry. The current operating fleet of 42 LNG fuelled ships worldwide has the potential to increase to a fleet of 1,800 by 2020, showing the tenacity and capability of natural gas to move into freight travel. A last interesting example is trains. While in very early stages, five train companies across the US and Canada will begin testing hybrid retrofitted engines capable of running off diesel and LNG this year. These engines, developed by General Electric and Caterpillar, are meant to capitalize on the fact that fuel costs are typically
25% of total expenses for most railroads. The main trade off, it seems, at the moment is the initial capital investment required (Natural gas engines cost on average 20% more than their gasoline-fuelled counterparts) to utilize a natural gas fueled vehicle, followed by a lower operating cost after.
An added consideration for the relative price risk is the perceived environmental benefits of natural gas, burning cleaner and more efficiently while emitting fewer greenhouse gases. We have already witnessed shifts in electrical power toward natural gas and away from coal, increasing the demand for natural gas. There exists the possibility of legislative action or more stringent environment guidelines that might further shift relative demand over time. The future relative price impact from regulatory issues is not so clear as they involve complex sets of issues, from granting permits for new refineries, to approval (or not) of the Keystone pipeline, to allowing more exports of both gas and crude oil, all with many direct effects as well as potentially powerful unintended consequences.
Round III: How Rapidly Does New
Investment Change the Game?
The active future contracts for NYMEX WTI Crude and
Henry Hub Natural Gas show a slight closing of the price spread gap over the next 5 years. And interestingly, the futures market indicates a higher natural gas price and a lower crude price. Nevertheless, our scenario is that the
BTU price gap may close faster than many appreciate given the “hedge-able” long-term cost difference as direct competition between the two sources of energy increases in tandem with the indirect competition already in place.
3 MARKET INSIGHTS
JANUARY 21, 2014
On the supply side, both energy sources are expected to see further US production increases over the next decade.
From an international markets perspective, this may reduce
US oil imports and increase coal exports (as natural gas displaces coal in power generation as noted earlier). On the demand side, varied and expanding uses of natural gas suggest rapidly rising demand. Meanwhile, increased direct competition in the transport sector implies a downward pull on oil prices relative to natural gas. Overall the US is becoming more energy transport efficient, so the natural gas versus oil battle will be competed in a slow growing market, and that will pronounce the influence of any inroads that natural gas might make on market share in the sector.
Our base case scenario is that the energy price spread between WTI crude oil and US natural gas will narrow much faster than the official energy agencies or futures markets currently suggest. There are many alternative scenarios and a number of risks, especially from the international sector. Indeed, if US policies constraining the export of domestic crude oil or natural gas were to change, then we would argue the energy gap might close even faster.
Consider how the variability of global and domestic gas prices would be affected by US natural gas exports if untethered from current export restrictions, given that natural gas prices are about three times higher in Europe and even higher in Japan, compared to the US. And, then there are the rules that favor export of refined products and restrict exports of crude oil. An easing of US crude export restrictions is not a likely factor at the moment, but if the rules were to be relaxed, then the dynamic between domestic oil and refinery production would be in the cross hairs.
Even after taking all the global and regulatory risks into consideration, we believe the consensus among market participants suggests an extremely long time frame for closing the US energy price gap. There may be a lack of appreciation of the large investments in new and expanded uses of natural gas that are in progress but have not yet reached fruition. That is, considerable money and brain power is already being spent to develop natural gas in the transportation sector, although the results are only starting to become visible. As the direct competition actually materializes and can be seen by everyone in the energy use data, market perceptions may start to change.
Even if natural gas just increases its share of energy use for transportation from 3% to the 7% to 10% range over the next five years, that could translate into a dramatically faster closing of the energy price gap than the consensus now suggests. Of course, whether the energy gap shrinking results from crude oil prices falling or natural gas prices rising is another story, determined by a plethora of factors and involving much more impact from global factors – making it a topic for a future energy market report.
Samantha Azzarello
Economist – Research and Product Development
+1 212.299.2803 samantha.azzarello@cmegroup.com
To read more of our Market Insights, visit cmegroup.com/marketinsights
All examples in this report are hypothetical interpretations of situations and are used for explanation purposes only. The views in this report reflect solely those of the authors and not necessarily those of
CME Group or its affiliated institutions. This report and the information herein should not be considered investment advice or the results of actual market experience.
CME Group is a trademark of CME Group Inc. The Globe Logo, CME, Chicago Mercantile Exchange and Globex are trademarks of Chicago Mercantile.
Exchange Inc. CBOT and the Chicago Board of Trade are trademarks of the Board of Trade of the City of Chicago, Inc. New York Mercantile Exchange and NYMEX are registered trademarks of the New York Mercantile Exchange, Inc. COMEX is a trademark of Commodity Exchange, Inc.
The information within this brochure has been compiled by CME Group for general purposes only. CME Group assumes no responsibility for any errors or omissions.
Although every attempt has been made to ensure the accuracy of the information within this brochure. Additionally, all examples in this brochure are hypothetical situations, used for explanation purposes only, and should not be considered investment advice or the results of actual market experience.
Copyright © 2014 CME Group. All rights reserved.
4 MARKET INSIGHTS


