Date - Indiana University Bloomington
advertisement

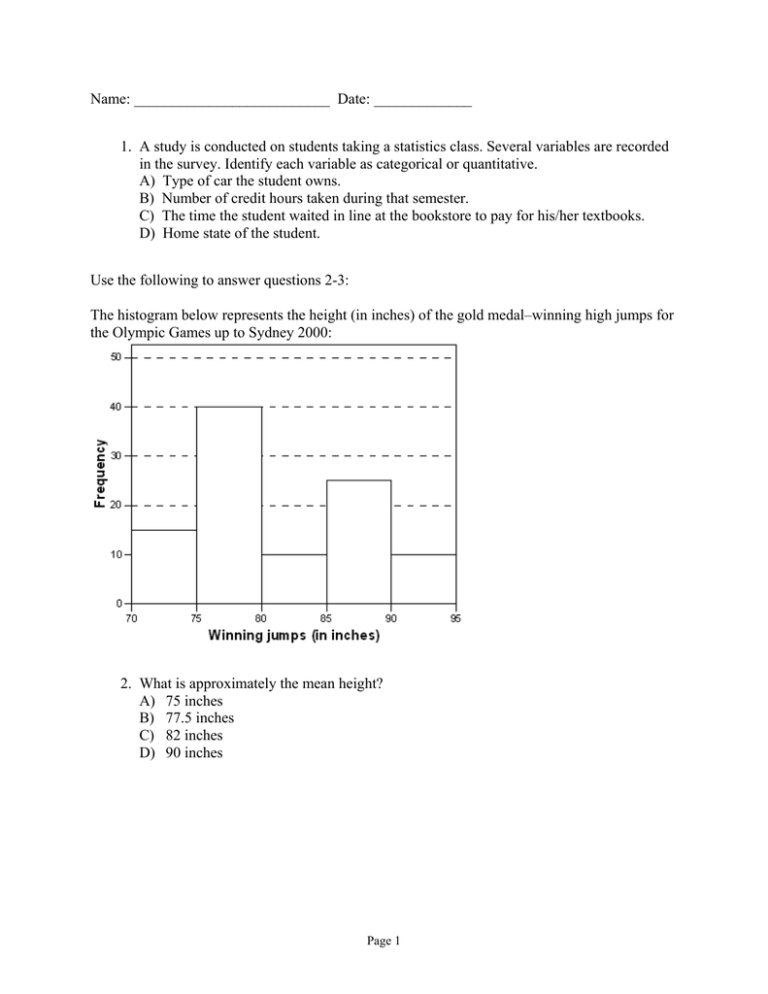
Name: __________________________ Date: _____________ 1. A study is conducted on students taking a statistics class. Several variables are recorded in the survey. Identify each variable as categorical or quantitative. A) Type of car the student owns. B) Number of credit hours taken during that semester. C) The time the student waited in line at the bookstore to pay for his/her textbooks. D) Home state of the student. Use the following to answer questions 2-3: The histogram below represents the height (in inches) of the gold medal–winning high jumps for the Olympic Games up to Sydney 2000: 2. What is approximately the mean height? A) 75 inches B) 77.5 inches C) 82 inches D) 90 inches Page 1 3. What is approximately the percentage of these winning jumps that were at least 7'1” high (85 inches)? A) 9% B) 14% C) 23% D) 35% Use the following to answer questions 4-8: The Insurance Institute for Highway Safety publishes data on the total damage suffered by compact automobiles in a series of controlled, low-speed collisions. The cost for a sample of 9 cars, in hundreds of dollars, is provided below. 10 6 8 10 4 3.5 7.5 8 9 4. What is the median cost of the total damage suffered for this sample of cars? A) $400 B) $730 C) $800 D) $1000 5. What is the first quartile for the above data? A) $350 B) $500 C) $600 D) $800 6. What is the interquartile range of the above data? A) $300 B) $350 C) $400 D) $450 7. What is the mean of the total damage suffered for this sample of cars? A) $239 B) $733 C) $800 D) $950 Page 2 8. Using the correct units, what is the value of the variance? A) 224.85 dollars B) 238.48 dollars2 C) 50,555.54 dollars2 D) 56,875 dollars2 9. This is a standard deviation contest. Which of the following sets of four numbers has the largest possible standard deviation? A) 7, 8, 9, 10 B) 5, 5, 5, 5 C) 0, 0, 10, 10 D) 0, 1, 2, 3 10. A sample of 16 people is taken and their weights are measured. The standard deviation of these 16 measurements is computed to be 5.4. What is the variance of these measurements? A) 2.24 lbs B) 2.24 lbs2 C) 29.16 lbs D) 29.16 lbs2 11. The following curve is to be a density curve for the variable x: What must be the value of the point on the vertical axis labeled H for this to be a proper density function? A) 1.60 B) 1.00 C) 0.80 D) 1.25 E) 0.625 Page 3 12. Which of the following statements about the Mean and the Median of a density curve are FALSE? A) The Median is the point on the axis that divides the area under the density curve in two equal halves. B) The Median and the Mean have the same value if the density curve is symmetric. C) The Mean is the “balance point” of the density curve. D) The Median of a skewed density curve is pulled away from the Mean in the direction of the long tail. E) For a symmetric density curve both the Mean and the Median are at the center of the curve. 13. The time to complete a standardized exam is approximately Normal with a mean of 70 minutes and a standard deviation of 10 minutes. Using the 68-95-99.7 rule, what percentage of students will complete the exam in under an hour? A) 68% B) 32% C) 16% D) 5% 14. The scores on a university examination are Normally distributed with a mean of 62 and a standard deviation of 11. If the bottom 5% of students will fail the course, what is the lowest mark that a student can have and still be awarded a passing grade? A) 62 B) 57 C) 44 D) 40 15. Fill in the blank. When creating a scatterplot, one should use the ______________ axis for the explanatory variable. 16. Fill in the blank. A researcher is interested in determining if one could predict the score on a statistics exam from the amount of time spent studying for the exam. The variable _______________ is the explanatory variable in this study. Page 4 17. A study found a correlation of r = –0.61 between the gender of a worker and his or her income. Determine whether each of the following conclusions regarding this correlation coefficient is true or false. A) Women earn more than men on the average. B) Women earn less than men on the average. C) An arithmetic mistake was made. Correlation must be positive. D) This measurement makes no sense; r can only be measured between two quantitative variables. 18. As Swiss cheese matures, a variety of chemical processes take place. The taste of matured cheese is related to the concentration of several chemicals in the final product. In a study of cheese in a certain region of Switzerland, samples of cheese were analyzed for lactic acid concentration and were subjected to taste tests. The numerical taste scores were obtained by combining the scores from several tasters. A scatterplot of the observed data is shown below: What is a plausible value for the correlation between lactic acid concentration and taste rating? A) 0.999 B) 0.7 C) 0.07 D) –0.7 Page 5 19. In a statistics course, a linear regression equation was computed to predict the final exam score from the score on the midterm exam. The equation of the least-squares regression line was ŷ = 10 + 0.9x, where y represents the final exam score and x is the midterm exam score. Suppose Joe scores a 90 on the midterm exam. What would be the predicted value of his score on the final exam? A) 81 B) 89 C) 91 D) Cannot be determined from the information given. We also need to know the correlation. 20. Determine whether each of the following statements is true or false. A) The least-squares regression line is the line that makes the square of the correlation in the data as large as possible. B) The least-squares regression line is the line that makes the sum of the squares of the vertical distances of the data points from the line as small as possible. C) The least-squares regression line is the line that best splits the data in half, with half of the points above the line and half below the line. D) The least-squares regression line always passes through the point ( x , y ), the means of the explanatory and response variables, respectively. Use the following to answer questions 21-22: Data were obtained from the A&W Web site for the Total Fat in grams and the Protein content in grams for various items on their menu. Some summary statistics are also provided: Page 6 21. The slope of the least-squares regression line for Total Fat on Protein is A) -0.998. B) 1.005. C) 0.962. D) 2.170. E) 0.966. 22. The intercept for the least-squares regression line of Total Fat on Protein is A) -0.998. B) 1.005. C) 0.962. D) 2.170. E) 0.966. Use the following to answer questions 23-25: A review of voter registration records in a small town yielded the following table of the number of males and females registered as Democrat, Republican, or some other affiliation: 23. What proportion of the male voters is registered as a Democrat? A) 0.15 B) 0.30 C) 0.33 D) 300 24. What proportion of registered Democrats is male? A) 0.15 B) 0.30 C) 0.33 D) 300 Page 7 25. What proportion of all voters is male and registered as a Democrat? A) 0.15 B) 0.30 C) 0.33 D) 300 Page 8 Answer Key 1. 2. 3. 4. 5. 6. 7. 8. 9. 10. 11. 12. 13. 14. 15. 16. 17. 18. 19. 20. 21. 22. 23. 24. 25. A) categorical, B) quantitative, C) quantitative, D) categorical C D C B D B D C D D D C C horizontal amount of time spent studying for the exam A) False, B) False, C) False, D) True B C A) False, B) True, C) False, D) True B D B C A Page 9


