Measurement of phase diagrams of optical
advertisement

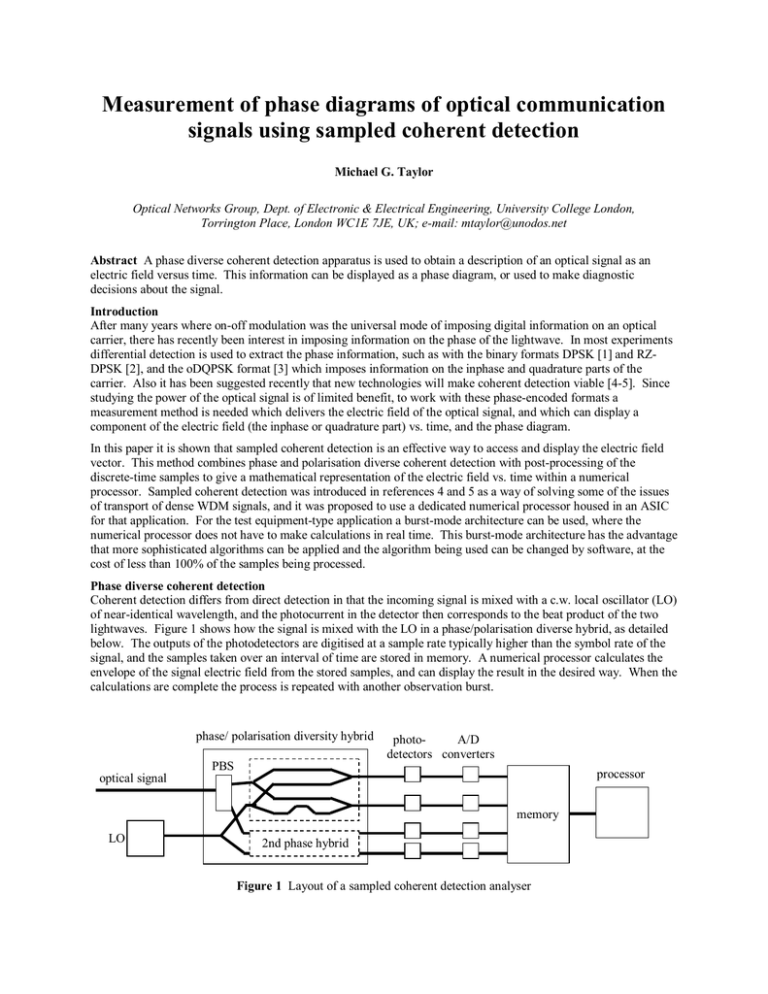
Measurement of phase diagrams of optical communication signals using sampled coherent detection Michael G. Taylor Optical Networks Group, Dept. of Electronic & Electrical Engineering, University College London, Torrington Place, London WC1E 7JE, UK; e-mail: mtaylor@unodos.net Abstract A phase diverse coherent detection apparatus is used to obtain a description of an optical signal as an electric field versus time. This information can be displayed as a phase diagram, or used to make diagnostic decisions about the signal. Introduction After many years where on-off modulation was the universal mode of imposing digital information on an optical carrier, there has recently been interest in imposing information on the phase of the lightwave. In most experiments differential detection is used to extract the phase information, such as with the binary formats DPSK [1] and RZDPSK [2], and the oDQPSK format [3] which imposes information on the inphase and quadrature parts of the carrier. Also it has been suggested recently that new technologies will make coherent detection viable [4-5]. Since studying the power of the optical signal is of limited benefit, to work with these phase-encoded formats a measurement method is needed which delivers the electric field of the optical signal, and which can display a component of the electric field (the inphase or quadrature part) vs. time, and the phase diagram. In this paper it is shown that sampled coherent detection is an effective way to access and display the electric field vector. This method combines phase and polarisation diverse coherent detection with post-processing of the discrete-time samples to give a mathematical representation of the electric field vs. time within a numerical processor. Sampled coherent detection was introduced in references 4 and 5 as a way of solving some of the issues of transport of dense WDM signals, and it was proposed to use a dedicated numerical processor housed in an ASIC for that application. For the test equipment-type application a burst-mode architecture can be used, where the numerical processor does not have to make calculations in real time. This burst-mode architecture has the advantage that more sophisticated algorithms can be applied and the algorithm being used can be changed by software, at the cost of less than 100% of the samples being processed. Phase diverse coherent detection Coherent detection differs from direct detection in that the incoming signal is mixed with a c.w. local oscillator (LO) of near-identical wavelength, and the photocurrent in the detector then corresponds to the beat product of the two lightwaves. Figure 1 shows how the signal is mixed with the LO in a phase/polarisation diverse hybrid, as detailed below. The outputs of the photodetectors are digitised at a sample rate typically higher than the symbol rate of the signal, and the samples taken over an interval of time are stored in memory. A numerical processor calculates the envelope of the signal electric field from the stored samples, and can display the result in the desired way. When the calculations are complete the process is repeated with another observation burst. phase/ polarisation diversity hybrid optical signal PBS photoA/D detectors converters processor memory LO 2nd phase hybrid Figure 1 Layout of a sampled coherent detection analyser The function of a phase diverse hybrid is to combine the signal and LO in (at least) two paths going to separate photodetectors, where the LO has a π/2 phase shift in one path compared to the other. The information from the two photodetectors delivers the inphase and quadrature parts of the optical signal, whereas with a single coherent detection path only one component of the signal’s electric field can be determined. The phase diverse combining stage is indicated in the dotted box of Figure 1. Because coherent beating only happens when the local oscillator has a similar state of polarisation (SOP) to the signal, and it is not possible to predict the signal’s SOP, it is necessary to add polarisation diversity for the coherent detection method to work for all possible signal SOPs. As shown in Figure 1, the signal is separated by a polarisation beamsplitter (PBS) into two orthogonal components, and each of these goes into a separate phase diverse combining stage. The information from the four photodetectors enables the electric field vector for both polarisation components to be calculated. The phase diverse coherent detection process is described mathematically below. The equations that follow use the outputs of one phase diverse hybrid and assume that the signal is aligned in SOP with the LO in that hybrid. The equations can be extended to take into account the polarisation diverse outputs, in which case the Jones vector is calculated, instead of simply the complex electric field envelope. The electric field of the signal can be written as Re[Es(t)exp(i(ωst+φs))], where Es(t) is the complex envelope containing the information encoded on the optical signal, ωs is the angular frequency of the optical carrier, and φs is the slowly varying phase arising from the phase noise of the carrier. The local oscillator electric field can be written as Re[ELO exp(i(ωLOt+φLO))], where ELO is a constant given that the local oscillator is c.w., and ωLO and φLO are the angular frequency and phase of the LO. The electric field of the light arriving at each of the two outputs of the phase diverse hybrid is the sum of the signal and LO fields, as follows E1 = Re[E s (t ) exp(i (ω s t + φ s )) + E LO exp(i (ω LO t + φ LO ))] E 2 = Re[E s (t ) exp(i (ω s t + φ s )) + iE LO exp(i(ω LO t + φ LO ))] The photodetector responds to the optical power, which is related to the electric field by P1 = E1* E1 = E s (t ) + E LO 2 2 2 2 [ ] + 2 Re E s (t )E LO * exp(i (ω s − ω LO )t + φ s − φ LO ) |ELO| is constant with time, and |Es(t)| is small given that the local oscillator power is much larger than the signal power. We can write the difference between P1 and its time average as ∆P1, and [ ] [ ] ∆P1 = 2 Re E s (t )E LO * exp (i (ω s − ω LO )t + φ s − φ LO ) Alternatively, ∆P1 can be obtained by differential detection using a 4-port phase diverse combining stage instead of 2-port, and the common mode terms are rejected inherently. Similarly for the second output of the phase diverse hybrid ∆P2 = 2 Im E s (t )E LO * exp (i (ω s − ω LO )t + φ s − φ LO ) The electric field envelope of the signal can therefore be constructed within the numerical processor by 1 E s (t ) = exp(− i(ω s − ω LO )t − (φ s − φ LO )) (∆P1 + i∆P2 ) 2 E LO * To calculate the Jones vector, the top two outputs of the phase/polarisation diverse hybrid in Figure 1 are used to obtain the first element, and the bottom outputs the second element of the Jones vector. The phase of the signal with respect to the LO, (ωs-ωLO)t+ φs–φLO, is estimated from the values of (∆P1+i∆P2) using a method appropriate to the signal modulation format. For example for carrier-suppressed formats a power law function followed by a phase locked loop, or a decision directed phase locked loop, can be used [6]. The sample rate must be high enough to satisfy the Nyquist criterion. The symbol clock can be recovered from the 2 samples using an appropriate algorithm, for example by finding a spectral line in |Es(t)| , and then the values of Es(t) at the symbol centre can be determined by interpolation. A hardware-based clock recovery solution is not needed. The Jones vector as a function of time constitutes a complete description of the optical signal, from which any signal parameter can be derived. The main limitation on the measurement is that only information within (sampling rate)/2 of the local oscillator is recorded. The use of a pulsed LO has recently been demonstrated as a way to increase the observation bandwidth [7]. An additional limitation is that the A/D conversion process adds some noise, which can be significant for some measurements, but it is possible to apply averaging to reduce the noise. Polarisation diversity was not employed in the experiments used to generate the data shown in this paper. Only one phase diverse hybrid was used, and the SOP of the signal was matched to the LO using a manual polarisation controller. A real time sampling scope (either a Tektronix TDS6604 or Agilent Infinium 54832B) was used in place of the A/D converters and memory. The data was transferred to a PC after the acquisition was complete to process the samples. The sampling rate was set at the Nyquist rate or higher. The frequency difference between the signal 2 and LO was at most 10% of the symbol rate. In the offline processing the symbol clock was recovered from |Es(t)| , and then the values of Es(t) at the symbol centre estimated by interpolation. To estimate the optical phase a square law function (for BPSK signals) or 4th power law function (for QPSK) was used, followed by smoothing of the open loop phase. Examples of electric field measurements The phase diagram is a plot of the quadrature part against the inphase part of the signal, or equivalently a plot of the complex envelope on the complex plane. Figure 2 shows an example of a 10.7 Gb/s BPSK signal at the output of the transmitter and after 90 km of standard singlemode fiber. The sampling rate was 20 GSa/s. In the phase diagrams (Figure 2(a) & (c)) the points in time at the centre of the symbol (when a decision is made) are marked with circles, and the lines between them show the trajectory followed between symbols. The lines appear smooth because multiple points were interpolated between sample times. The corresponding eye diagrams of the inphase (real) component of the electric filed are shown in Figure 2(b) & (d). The closure of the eye is due to the chromatic dispersion of the 90 km of fiber. The groupings of the bit centres on arcs of a circle in Figure 2(c) are consistent with chromatic dispersion as the mechanism for eye closure. A different curve would be followed if polarisation mode dispersion or a combination of self phase modulation and chromatic dispersion were responsible for the eye closure, although the eye diagram of Figure 2(d) would look about the same. Figure 3(a) shows the phase diagram of a 1.6 Gbaud QPSK signal obtained from a dual Mach-Zehnder modulator made in GaAs/AlGaAs, as described in reference 3. The sampling rate was 4 GSa/s. The eye diagrams associated 2.5 2 2 1.5 1 1 0.5 0 0 -0.5 -1 -1 -1.5 -2 -2 -2.5 -2.5 -2 -1.5 -1 -0.5 0 0.5 1 1.5 2 2.5 50 100 Time (ps) 150 -3 0 50 100 Time (ps) 150 3 3 2 2 1 1 0 0 -1 -1 -2 -2 -3 -3 (c) 0 (b) (a) -2 -1 0 1 2 3 (d) Figure 2 Phase and eye diagrams of 10 Gb/s signal (a) & (b) at transmitter output, and (c) & (d) after 90 km fiber. 6 2.5 2 4 1.5 1 2 0.5 0 0 -0.5 -2 -1 -1.5 -4 -2 -2.5 -2.5 -2 -1.5 -1 -0.5 0 0.5 1 1.5 2 2.5 (a) (b) -6 0 0.2 0.4 0.6 Time (ns) 0.8 1 Figure 3 QPSK transmitter output; (a) phase diagram, (b) eye diagrams for the two field components. with the inphase (real) and quadrature (imaginary) components are shown in Figure 3(b). In the phase diagram shown, one of the transitions between states is clearly missing. This is a result of the way the signals driving the two Mach-Zehnder modulators were derived; one of them is a replica of the other delayed by 15 bits, and a 215-1 bit PRBS was used. This set of conditions results in the absence of one of the transitions, and it might be undesirable for some experiments. The phase diagram shows clearly that the transition is missing, but it cannot be seen from the two eye diagrams. As well as simply displaying the electric field, with the sampled coherent measurement method it is possible to apply sophisticated algorithms to the values of the electric field stored in the processor. It is possible to calculate how much different impairments have impacted the signal. For example, the effects of additive optical noise, cross phase modulation and four wave mixing on a WDM signal have different signatures and could be separately accounted for. This kind of deduction is very hard to make with any other kind of measurement which looks only at the received signal. The processor can also predict what would happen to the signal if it were modified in specified ways. For example, Figure 4 shows what happens to the 10.7 Gb/s signal at the output of the 90 km fiber span if varying amounts of chromatic dispersion compensation are added. The conclusion is that -1580 ps/nm of dispersion provides the best eye opening. Other kinds of transform, such as PMD compensation, could similarly be applied. This approach can be very valuable for field applications given that, unlike this experiment, the reason why the signal is degraded is not known. Acknowledgements The author thanks Bookham Technology for the loan of the integrated laser-QPSK modulator, and Agilent and Tektronix for loans of real time sampling oscilloscopes, and S. Wood for assistance with the measurements. References 1. 2. 3. 4. 5. 6. 7. K. Yonenaga, S. Aisawa, N. Takachio, K. Iwashita, "Reduction of four-wave mixing induced penalty in unequally spaced WDM transmission system by using optical DPSK," IEE Electron. Lett., vol. 32, no. 23, p. 1218-1219, 1996. A.H. Gnauck et al., "2.5 Tb/s (64x42.7 Gb/s) transmission over 40x100 km NZDSF using RZ-DPSK format and all-Ramanamplified spans," OFC 2002, Anaheim, US, paper FC2, 2002. R.A. Griffin et al, "10 Gb/s optical differential quadrature phase shift key (DQPSK) transmission using GaAs/AlGaAs integration," OFC 2002, Anaheim, US, paper FD6, 2002. M. Tseytlin, O. Ritterbush, A. Salamon, "Digital, endless polarization control for polarization multiplexed fiber-optic communications," OFC 2003, Atlanta, US, paper MF83, 2003. M.G. Taylor, "Coherent detection method using DSP for demodulation of signal and subsequent equalization of propagation impairments," IEEE Phot. Tech. Lett., vol. 16, no. 2, 2004. J.G. Proakis, "Digital Communications," McGraw-Hill, 2000. C. Dorrer, J. Leuthold, C.R. Doerr, "Direct measurement of constellation diagrams of optical sources," OFC 2004, Los Angeles, US, paper PDP33, 2004. 12 11 10 9 best Q at -1580 ps/nm 8 Q 7 6 5 4 -2500 -2000 -1500 -1000 -500 Dispersion (ps/nm) 0 Figure 4 How varying receive end chromatic dispersion impacts signal Q factor


