Blueprint for Cargo-Oriented Development (COD) Minneapolis
advertisement

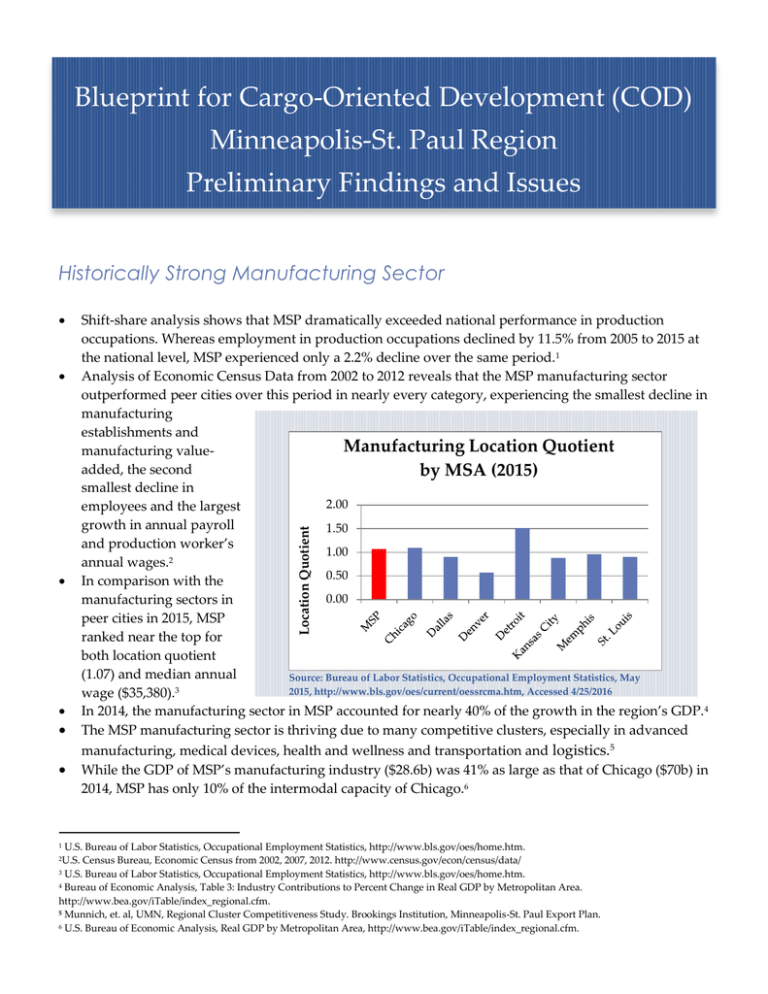
Blueprint for Cargo-Oriented Development (COD) Minneapolis-St. Paul Region Preliminary Findings and Issues Historically Strong Manufacturing Sector Shift-share analysis shows that MSP dramatically exceeded national performance in production occupations. Whereas employment in production occupations declined by 11.5% from 2005 to 2015 at the national level, MSP experienced only a 2.2% decline over the same period.1 Analysis of Economic Census Data from 2002 to 2012 reveals that the MSP manufacturing sector outperformed peer cities over this period in nearly every category, experiencing the smallest decline in manufacturing establishments and Manufacturing Location Quotient manufacturing valueadded, the second by MSA (2015) smallest decline in 2.00 employees and the largest growth in annual payroll 1.50 and production worker’s 1.00 annual wages.2 0.50 In comparison with the 0.00 manufacturing sectors in peer cities in 2015, MSP ranked near the top for both location quotient (1.07) and median annual Source: Bureau of Labor Statistics, Occupational Employment Statistics, May 2015, http://www.bls.gov/oes/current/oessrcma.htm, Accessed 4/25/2016 wage ($35,380).3 In 2014, the manufacturing sector in MSP accounted for nearly 40% of the growth in the region’s GDP.4 The MSP manufacturing sector is thriving due to many competitive clusters, especially in advanced manufacturing, medical devices, health and wellness and transportation and logistics.5 While the GDP of MSP’s manufacturing industry ($28.6b) was 41% as large as that of Chicago ($70b) in 2014, MSP has only 10% of the intermodal capacity of Chicago.6 Location Quotient U.S. Bureau of Labor Statistics, Occupational Employment Statistics, http://www.bls.gov/oes/home.htm. Census Bureau, Economic Census from 2002, 2007, 2012. http://www.census.gov/econ/census/data/ 3 U.S. Bureau of Labor Statistics, Occupational Employment Statistics, http://www.bls.gov/oes/home.htm. 4 Bureau of Economic Analysis, Table 3: Industry Contributions to Percent Change in Real GDP by Metropolitan Area. http://www.bea.gov/iTable/index_regional.cfm. 5 Munnich, et. al, UMN, Regional Cluster Competitiveness Study. Brookings Institution, Minneapolis-St. Paul Export Plan. 6 U.S. Bureau of Economic Analysis, Real GDP by Metropolitan Area, http://www.bea.gov/iTable/index_regional.cfm. 1 2U.S. Continued Manufacturing Growth The Manufacturing-Logistics Nexus MSP has a strong export economy that was growing rapidly before the recession, but Percent Change in Value of exports have fallen each year since 2011.7 Exports by MSA (2005-2014) This slowdown resulted in 100% slower growth in exports for 80% 60% MSP (33%) from 2005-2014 as 40% compared to peer cities such as 20% Chicago (81%), Dallas (40%), 0% 8 and Kansas City (68%). As noted by the Brookings Institution in its Minneapolis-St. Paul Export Plan, the Source: U.S. International Trade Administration, Metropolitan Export Minneapolis-St. Paul region is Data, http://www.trade.gov/mas/ian/metroreport/index.asp, Accessed not sufficiently capitalizing on 4/25/2016. its strong export assets, especially with regard to small and medium-size businesses and regional export planning.9 As supply chain efficiency increasingly affects overall production costs, the alignment of MSP’s manufacturing sector with its logistics capacity is a growing concern. Manufacturing-Logistics Impact on Persistent Poverty Areas of concentrated poverty remain a persistent problem in MSP10 Compounded by lack of accessibility to jobs, which is highlighted in the recent report, Spatial and Skills Mismatch of Unemployment and Job Vacancies: Opportunities for Integrated Transit Planning and Workforce Development 11 Most manufacturing job vacancies are located in suburbs12 Reclaiming industrial land linked to freight assets in MSP’s central cities offers opportunities to strengthen the manufacturing sector while reducing poverty, but only if these linked efforts are elements of a comprehensive metropolitan strategy.13 Next Steps Technical Memorandum, June 2016 Strategic Convening, July 2016 Contact: David Chandler, Center for Neighborhood Technology, david@cnt.org, 773-269-4023 U.S. International Trade Administration, Metropolitan Export Data, http://www.trade.gov/mas/ian/metroreport/index.asp. Ibid. 9 Brookings Institution, Minneapolis-St. Paul Export Plan. 10 Metropolitan Council, Areas of Concentrated Poverty, June 2015. Metropolitan Council, Thrive 2040 Plan. 11 Fan, et. al, UMN, Spatial and Skills Mismatch of Unemployment and Job Vacancies: Opportunities for Integrated Transit Planning and Workforce Development, May 2016. 12 Ibid. 13 Metropolitan Council, Thrive 2040 Plan. St. Paul Port Authority and ICIC, An Industrial Strategy for the City of St. Paul. City of St. Paul, West Midway Industrial Area Comprehensive Plan. 7 8

