Annex 18A: Model input parameters and calibration
advertisement
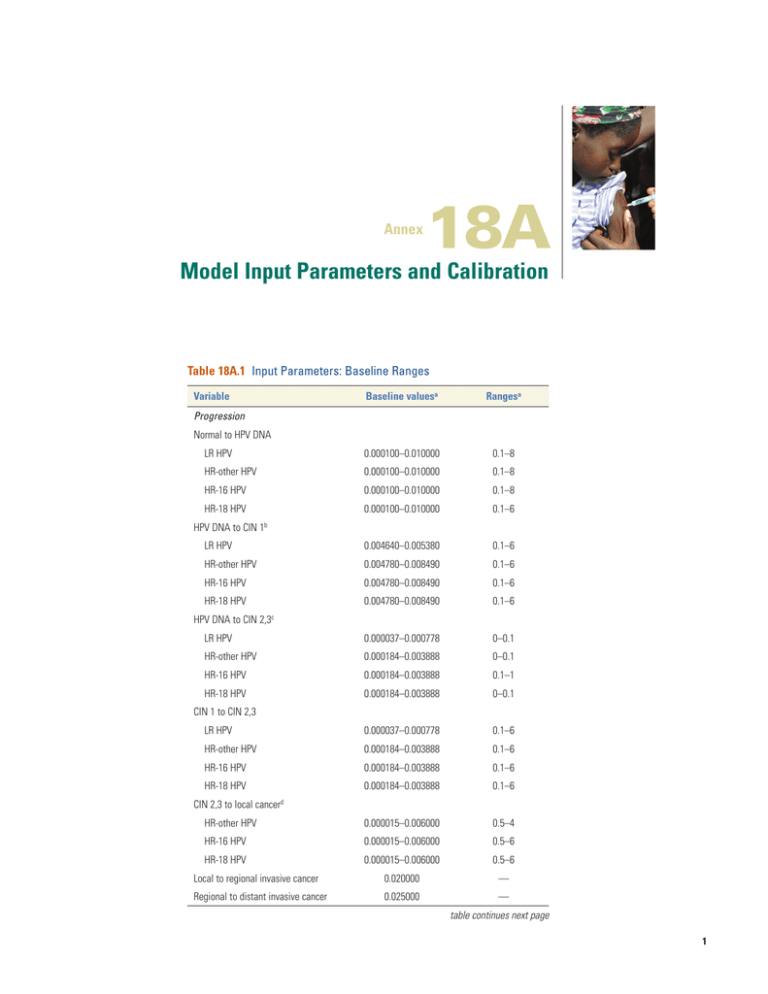
Annex 18A Model Input Parameters and Calibration Table 18A.1 Input Parameters: Baseline Ranges Variable Baseline valuesa Rangesa LR HPV 0.000100–0.010000 0.1–8 HR-other HPV 0.000100–0.010000 0.1–8 HR-16 HPV 0.000100–0.010000 0.1–8 HR-18 HPV 0.000100–0.010000 0.1–6 LR HPV 0.004640–0.005380 0.1–6 HR-other HPV 0.004780–0.008490 0.1–6 HR-16 HPV 0.004780–0.008490 0.1–6 0.004780–0.008490 0.1–6 LR HPV 0.000037–0.000778 0–0.1 HR-other HPV 0.000184–0.003888 0–0.1 HR-16 HPV 0.000184–0.003888 0.1–1 HR-18 HPV 0.000184–0.003888 0–0.1 LR HPV 0.000037–0.000778 0.1–6 HR-other HPV 0.000184–0.003888 0.1–6 HR-16 HPV 0.000184–0.003888 0.1–6 0.000184–0.003888 0.1–6 HR-other HPV 0.000015–0.006000 0.5–4 HR-16 HPV 0.000015–0.006000 0.5–6 HR-18 HPV Progression Normal to HPV DNA HPV DNA to CIN 1b HR-18 HPV c HPV DNA to CIN 2,3 CIN 1 to CIN 2,3 HR-18 HPV d CIN 2,3 to local cancer 0.000015–0.006000 0.5–6 Local to regional invasive cancer 0.020000 — Regional to distant invasive cancer 0.025000 — table continues next page 1 Table 18A.1 Input Parameters: Baseline Ranges (continued) Variable Baseline valuesa Rangesa LR HPV 0.030500 3–8 HR-other HPV 0.030500 3–8 HR-16 HPV 0.030500 3–8 HR-18 HPV 0.030500 3–8 LR HPV 0.030500 0.5–6 HR-other HPV 0.030500 0.5–6 HR-16 HPV 0.030500 0.5–6 HR-18 HPV 0.030500 0.5–6 LR HPV 0.001410–0.006497 0.5–6 HR-other HPV 0.001410–0.006497 0.5–6 HR-16 HPV 0.001410–0.006497 0.5–6 HR-18 HPV 0.001410–0.006497 0.5–6 HR-other HPV 0 0.0–0.5 HR-16 HPV 0 0.6–1 HR-18 HPV 0 0.6–1 Regression HPV DNA to normale CIN 1 to normalf g CIN 2,3 to normal Other Immunity (HR HPV types only) Source: Goldie and others 2007. Note: CIN = Cervical intraepithelial neoplasia; DNA = deoxyribonucleic acid; HPV = human papillomavirus; HR = high risk; LR = low risk. a. Base case values are monthly probabilities, unless otherwise noted. A hyphenated range reported for a base case value represents age-specific probabilities. Except where noted, the ranges represent multiplier values, which are applied to baseline probabilities during calibration. b. Although baseline rates of progression and the range of multipliers were the same among all HR HPV types, the multipliers were allowed to vary independently by type in the parameter searches. c. A proportion of women with HPV who progress to CIN 1 transition directly to CIN 2,3. d. Infection with high-risk HPV is considered a necessary condition for progression to invasive cancer. e. We assumed that regression from HPV DNA to normal was equal among types and therefore the multipliers were held constant among types in the parameter searches. f. Although baseline rates of regression and the range of multipliers were the same among all HPV types, the multipliers were allowed to vary independently by type in the parameter searches. g. Of women with CIN 2,3, 70 percent regress to normal, 15 percent to HPV, and 15 percent to CIN 1. 2Cancer Table 18A.2 Cost Parameters for Screening, Diagnosis, and Treatment and Wage Rates by Income Quintile (2009 US$) Quintile I Cost parameter Direct medical cost per woman Quintile II Women’s time and OOP costs Direct medical cost per woman Women’s time and OOP costs Quintile III Direct medical cost per woman Women’s time and OOP costs Quintile IV Direct medical cost per woman Women’s time and OOP costs Quintile V Direct medical cost per woman Women’s time and OOP costs Screening Cytology 7.01 2.87 7.01 2.87 7.32 2.87 7.49 2.87 7.96 2.87 VIA 2.24 2.15 2.24 2.15 2.24 2.15 2.24 2.15 2.24 2.15 HPV rapid test 7.33 2.15 7.33 2.15 7.50 2.15 7.59 2.15 7.92 2.15 Colposcopy 4.41 2.27 4.41 2.27 4.58 2.27 4.67 2.27 4.93 2.27 Biopsy 5.91 Diagnosis 5.91 5.96 5.99 6.06 Treatment LEEP 66.41 166.00 66.41 166.00 Cryotherapy 10.32 2.27 10.32 2.27 Cold conization 293.15 178.50 293.15 Simple hysterectomy 409.48 291.00 Simple radiotherapy 290.18 252.00 Urban share of population (%) Daily wage rate 68.01 166.00 68.92 166.00 71.43 166.00 178.50 293.15 178.50 367.54 253.50 367.54 253.50 409.48 291.00 410.60 291.00 446.63 292.00 446.63 292.00 290.18 252.00 292.19 252.00 384.98 252.00 384.98 252.00 34 (5) 34 (5) 42 (8) 47 (9) 64 (10) 3.00 6.00 10.00 15.00 31.00 Sources: Levin and others 2010; Shi and others 2012. Note: Income quintiles are from lowest (I) to highest (V). Rural costs are from Shi and others (2012). Costs for urban settings and Beijing are from Levin and others (2010). Costs represent a weighted average for urban and rural for each income quintile. Numbers in parentheses indicate the percentage of women in each quintile assumed to live in or receive care in Beijing. HPV = human papillomavirus; LEEP = loop electrosurgical excision procedure; OOP = out of pocket; VIA = visual inspection with acetic acid. Model Input Parameters and Calibration 3 4Cancer 7.33 HPV rapid test 5.91 Biopsy 10.32 293.15 409.48 290.18 Cryotherapy Cold conization Simple hysterectomy Simple radiotherapy 0.00 269.68 309.35 188.17 110.77 110.77 559.86 718.83 481.32 10.32 177.17 5.91 4.41 7.33 3.35 1.16 Total 290.18 409.48 293.15 10.32 66.41 5.91 4.41 7.33 2.24 7.01 490.7 280.8 194.1 194.1 2.6 2.3 2.4 3.6 Direct Direct medical nonmedical Quintile II 780.89 690.32 293.15 204.44 260.52 5.91 7.00 9.64 4.66 10.64 Total 292.19 410.60 293.15 68.01 5.96 4.58 7.50 2.24 7.32 633.49 689.95 382.67 285.68 4.07 3.63 3.80 5.69 Direct Direct medical nonmedical Quintile III 925.68 1100.55 675.81 0.00 353.69 5.96 8.65 11.12 6.04 13.01 Total 384.98 446.63 367.54 68.92 5.99 4.67 7.59 2.24 7.49 902.93 1,007.12 811.69 415.22 6.16 5.50 5.75 8.62 Direct Direct medical nonmedical Quintile IV 1,287.91 1,453.75 1,179.22 0.00 484.13 5.99 10.83 13.09 7.99 16.11 Total 384.98 446.63 367.54 71.43 6.06 4.93 7.92 2.24 7.96 Direct medical 1,720.13 1,906.04 1,512.60 808.10 12.51 11.16 11.68 17.51 Direct nonmedical Quintile V Sources: Adapted from Levin and others 2010; Shi and others 2012. Note: Income quintiles are from lowest (I) to highest (V). OOP direct medical costs are 35 percent of total treatment costs shown in table 18A.2. We assume 35 percent of total treatment costs are privately financed in China (WHO Global Health Observatory). OOP direct nonmedical costs are transport and waiting times for patients. Transport and waiting times obtained from Shi and others (2012) were adjusted with new estimates of average wage rates by quintile. HPV = human papillomavirus; LEEP = loop electrosurgical excision procedure; OOP = out of pocket; VIA = visual inspection with acetic acid. 66.41 LEEP Treatment 4.41 Colposcopy Diagnosis 1.11 1.24 1.16 2.24 Direct nonmedical VIA Direct medical Quintile I Cytology Screening Cost parameter (2009 US$) Table 18A.3 Cost Parameters for Out-of-Pocket Expenses for Direct Medical, Direct Nonmedical, and Total Patient Costs by Income Quintile 2,105.11 2,352.67 1,880.13 0.00 879.53 6.06 17.44 19.08 13.92 25.47 Total Cervical cancer incidence per 100,000 woman-years Figure 18A.1 Calibration Results: Cervical Cancer Incidence from Best-Fitting Parameter Set Compared with Empirical Estimates 45 40 35 30 25 20 15 10 5 0 20–24 25–29 30–34 35–39 40–44 45–49 50–54 55–59 Goodness-of-Fit The model outputs with each input parameter set were compared with the calibration targets. Model fit to the targets was evaluated by constructing a goodness-of-fit score. A composite goodness-of-fit score for each parameter set was computed by summing the log likelihood of each model outcome (Kim and others 2007). Goodness-of-fit scores followed a chi-square distribution with the number of degrees of freedom equal to the number of targets. Age (years) Note: Dark blue lines depict the 95 percent confidence intervals of age-specific cervical cancer incidence in China (GLOBOCAN 2008). The light blue line represents the projected incidence of the best-fitting parameter set used in the model analysis. Proportion of HPV in precancer or cancer Figure 18A.2 HPV 16, 18 Type Distribution from Best-Fitting Parameter Set Compared with Empirical Estimates Input Parameter Acceptance Criterion We determined our best-fitting parameter set as the one with the lowest goodness-of-fit score—the model-­ generated input parameter whose simulated model outputs were simultaneously closest to all calibration targets. 1.0 0.9 REFERENCES 0.8 0.7 0.6 0.5 0.4 0.3 0.2 0.1 0 HPV 16 in CIN 23 HPV 18 in CIN 23 HPV 16 in cancer HPV 18 in cancer Note: Bars depict the 95 percent confidence intervals from empirical data on HPV 16/18 type distribution in CIN 23 and cancer (Bao and others 2008). Diamonds show the estimates projected by the best-fitting parameter set used in the model analysis. CIN = cervical intraepithelial neoplasia; HPV = human papillomavirus. NOTES FOR FIGURES Defining Calibration Targets Calibration targets included type distribution within CIN categories, age-specific cancer incidence, cumulative cancer incidence, and type- and age-specific duration of HPV infections and CIN. For each calibration target, we used the best available data sources to determine a point estimate and confidence interval. Targets were calculated using 95 percent confidence intervals of the binomial distribution in STATA/SE 9.0. Bao, Y. P., N. Li, J. S. Smith, Y. L. Qiao, and ACCPAB. 2008. “Human Papillomavirus Type Distribution in Women from Asia: A Meta-Analysis.” International Journal of Gynecological Cancer 18 (1): 71–79. GLOBOCAN. 2008. http://globocan.iarc.fr/. Goldie, S. J., J. J. Kim, K. Kobus, J. D. Goldhaber-Fiebert, J. Salomon, and others. 2007. “Cost-Effectiveness of HPV 16, 18 Vaccination in Brazil.” Vaccine 25 (33): 6257–70. Kim, J. J., K. M. Kuntz, N. K. Stout, S. Mahmud, L. L. Villa, and others. 2007. “Multiparameter Calibration of a Natural History Model of Cervical Cancer.” American Journal of Epidemiology 166 (2): 137–50. Levin, C. E., J. Sellors, J. F. Shi, L. Ma, Y. L. Qiao, and others. 2010. “Cost-Effectiveness Analysis of Cervical Cancer Prevention Based on a Rapid Human Papillomavirus Screening Test in a High-Risk Region of China.” International Journal of Cancer 127 (6): 1404–11. Shi, J. F., J. F. Chen, K. Canfell, X. X. Feng, J. F. Ma, and ­others. 2012b. “Estimation of the Costs of Cervical Cancer Screening, Diagnosis and Treatment in Rural Shanxi Province, China: A Micro-Costing Study.” BMC Health Services Research 12: 123. WHO (World Health Organization). “World Health Organization Global Health Observatory.” http://www .who.int/gho/en/. Model Input Parameters and Calibration 5
