OSU Drinking Statistics ...Oregon State University

Student Health Services
Home » Health Promotion » Alcohol and Other Drugs
OSU Drinking Statistics
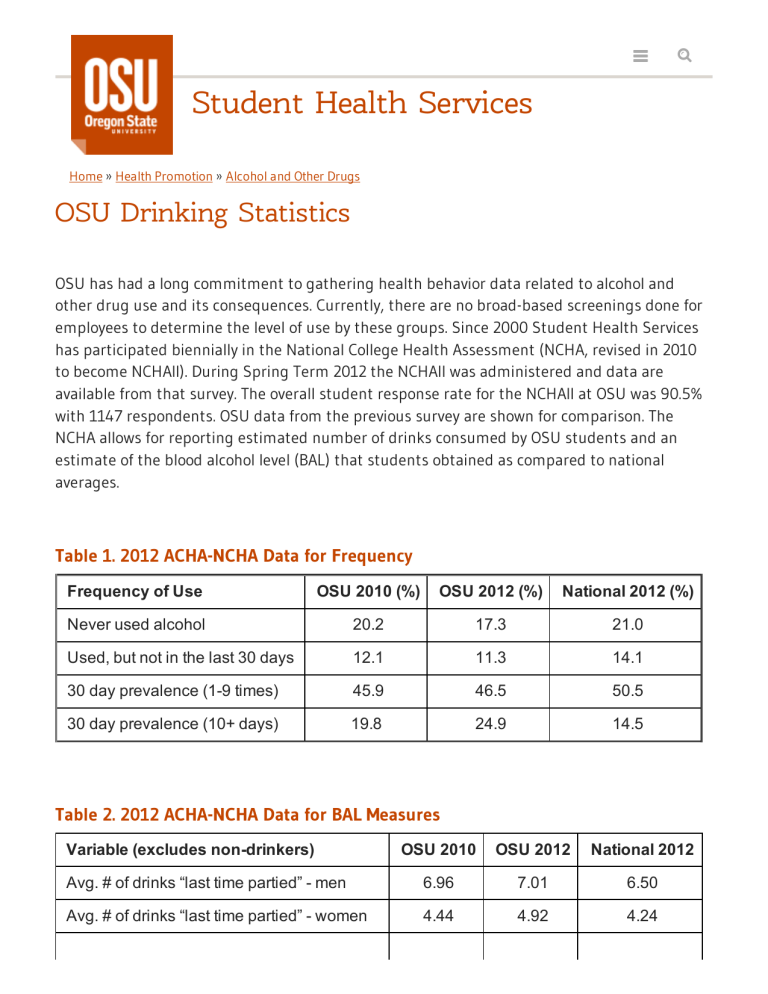
OSU has had a long commitment to gathering health behavior data related to alcohol and other drug use and its consequences. Currently, there are no broad-based screenings done for employees to determine the level of use by these groups. Since 2000 Student Health Services has participated biennially in the National College Health Assessment (NCHA, revised in 2010 to become NCHAII). During Spring Term 2012 the NCHAII was administered and data are available from that survey. The overall student response rate for the NCHAII at OSU was 90.5% with 1147 respondents. OSU data from the previous survey are shown for comparison. The
NCHA allows for reporting estimated number of drinks consumed by OSU students and an estimate of the blood alcohol level (BAL) that students obtained as compared to national averages.
Table 1. 2012 ACHA-NCHA Data for Frequency
Frequency of Use
Never used alcohol
Used, but not in the last 30 days
30 day prevalence (1-9 times)
30 day prevalence (10+ days)
OSU 2010 (%) OSU 2012 (%) National 2012 (%)
20.2
17.3
21.0
12.1
45.9
19.8
11.3
46.5
24.9
14.1
50.5
14.5
Table 2. 2012 ACHA-NCHA Data for BAL Measures
Variable (excludes non-drinkers) OSU 2010 OSU 2012 National 2012
Avg. # of drinks “last time partied” - men
Avg. # of drinks “last time partied” - women
6.96
4.44
7.01
4.92
6.50
4.24
Avg. # of drinks “last time partied” - total
Blood Alcohol Level - men
Blood Alcohol Level - women
Blood Alcohol Level - total
5.75
0.08
0.08
0.08
6.00
0.08
0.10
0.09
5.02
0.08
0.07
0.08
Table 3. 2012 OSU NCHA Data - Frequency Use/Negative Consequences
Frequency of Negative
Consequences (students who drank alcohol in the last 12 months;; non- drinkers excluded from analysis)
OSU 2010
(%)
OSU 2012
(%)
National
2012 (%)
Doing something later regretted
Forgetting where they were/what done
(black-out)
Physically injured yourself
Unprotected sex
Physically injured another person
Someone had sex with you without getting your consent
Had sex with someone without getting their consent
Got in trouble with the police
Seriously considered suicide
39.0
38.9
21.5
20.0
3.9
3.0
0.6
4.6
2.0
43.8
42.8
20.9
25.2
3.6
2.8
1.1
7.1
2.2
0.6
3.9
2.2
37.7
34.0
16.7
20.3
2.5
2.0
Besides understanding negative consequences, it is important to determine the level at which OSU students are engaging in behaviors that may reduce or limit the risk/harm that can come from excessive alcohol use. Information on harm-reduction behaviors is presented
(Table 4) as a way to determine areas where more education could occur and to determine if our students have used any means of protecting themselves from possible alcohol related harm.
Table 4. 2012 OSU NCHA Data - Harm Reduction Behaviors
Behavior (non-drinkers excluded)
OSU 2010
(%)
OSU 2012
(%)
Alternate non-alcoholic with alcoholic beverages
Determine in advance not to exceed a set number of drinks
Choose not to drink alcohol
Use a designated driver
Eat before and/or during drinking
Have a friend let you know when you have had enough
Keep track of how many drinks being consumed
Pace drinks to one or fewer an hour
Avoid drinking games
Stay with same group of friends the entire time drinking
Stick with only one kind of alcohol when drinking
Reported one or more of the above strategies
25.8
34.1
21.2
83.1
76.2
31.0
61.0
22.0
29.4
81.8
42.3
96.4
26.4
32.3
18.8
77.6
76.8
32.8
56.0
21.8
22.5
78.1
38.9
95.5
National
2012 (%)
29.6
48.0
97.6
39.4
25.0
84.6
78.6
38.0
65.4
29.0
35.1
84.5
More than 95 percent of OSU students who drink report using at least one harm reduction strategy to stay safer if they choose to drink.
Printer-friendly version
Health Promotion
Alcohol and Other Drugs up2u e-CHUG
e-TOKE
Alcohol Presentations for Fraternities and Sororities
Collegiate Recovery Community
Alcohol Mixed Energy Drinks
Prescription Drug Abuse
Alcohol 101
Concerned About a Friend?
IMPACT
Outreach and Consultation
Alcohol and the Law
For Faculty and Staff
For Parents
OSU Drinking Statistics
Alcohol Resources
Beaver Strides
College Gambling
Health Coaching
Nutrition
Peer Health Advocates
Peer Theater
Sexual Health
Sexual Violence Awareness and Prevention
Sleep
Tobacco Cessation
Outreach Presentations
Home
Fees for Services
Patient Portal
International Students
Policies and Guidelines
Infectious Diseases
Managing Stress
Forms
Contact Us
Site Map
Contact Info
Student Health Services
201 Plageman Building
Corvallis, OR 97331
541-737-9355
Contact Us
Webmaster
Copyright ©2014 Oregon State University
Disclaimer
About
About SHS
Mission, Vision And Values
Operating Hours
Phone Numbers
Location And Parking
Accessible Parking
Staff Directory
Job Openings
Student Health Advisory Board
Volunteer!
Community Health Partners
Feature Articles
Social Media Directory
Resources
Fees For Services
Patient Portal
Healthier At School® Online Self-Care Guide
International Students
Forms
Policies And Guidelines
Infectious Diseases
Advance Directive Information
Managing Stress
Contact Us
Departments
Clinic Services
Health Promotion
Insurance
Billing
Pharmacy
For New Students
Domestic Students
International Students
Veterans
Veterinary Medicine
For Parents
Fees For Services
Infectious Diseases
Insurance
Policies And Guidelines
What's New
Health / Wellness
SHS @ Dixon
Health And Wellness Alignment
Counseling And Psychological Services
Recreational Sports
"Be Well"
