TA Section 10, ECN 102 Spring Quarter 2015 - ILhyun Cho
advertisement

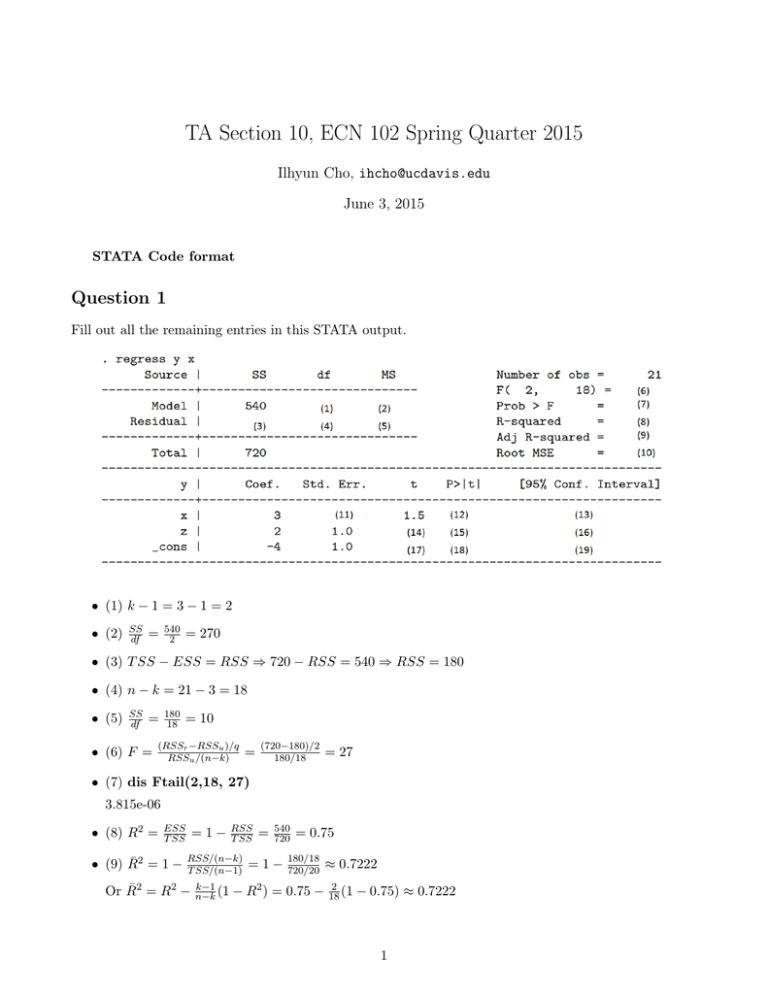
TA Section 10, ECN 102 Spring Quarter 2015 Ilhyun Cho, ihcho@ucdavis.edu June 3, 2015 STATA Code format Question 1 Fill out all the remaining entries in this STATA output. • (1) k − 1 = 3 − 1 = 2 • (2) SS df = 540 2 = 270 • (3) T SS − ESS = RSS ⇒ 720 − RSS = 540 ⇒ RSS = 180 • (4) n − k = 21 − 3 = 18 • (5) SS df = • (6) F = 180 18 = 10 (RSSr −RSSu )/q RSSu /(n−k) = (720−180)/2 180/18 = 27 • (7) dis Ftail(2,18, 27) 3.815e-06 • (8) R2 = ESS T SS • (9) R̄2 = 1 − =1− RSS T SS RSS/(n−k) T SS/(n−1) Or R̄2 = R2 − k−1 n−k (1 = 540 720 =1− = 0.75 180/18 720/20 − R2 ) = 0.75 − ≈ 0.7222 2 18 (1 − 0.75) ≈ 0.7222 1 • (10) se = • (11) 3 1.5 r 1 n−k q q RSS 180 2 = (y − y ˆ ) = i i i=1 n−k 18 ≈ 3.1623 Pn =2 • (12) dis 2*ttail(18, 1.5) .15095045 • (13) dis invttail(18, 0.025) 2.100922 3 ± 2.100922 × 2 • (14) 2 1 =2 • (15) dis 2*ttail(18, 2) .06082147 • (16) dis invttail(18, 0.025) 2.100922 2 ± 2.100922 × 1 • (17) −4 1 = −4 • (18) dis 2*ttail(18,4) .00083983 • (19) dis invttail(18, 0.025) 2.100922 −4 ± 2.100922 × 1 2 Question 2 Use data in file cobbdouglas.cvs for 25 factories. • Do there appear to be any outliers? graph box q • Give a 95 % confidence interval for the population mean output. su q dis invttail(24, 0.025) 2.0638986 2405.835 ± 2.0638986 × 2319.903 √ 25 • Calculate the coefficient of variation for q, k, l. su q k l dis 2319.903/2405.835 .96428184 dis 3163.282/2843.944 1.112287 dis 340.3693/418.7168 .81288666 • twoway (scatter q k)(lfit q k) • Following regression of output against capital, give a 95% confidence interval for the predicted value of output when capital equals 4000. su k dis invttail(23, 0.025) reg q k 368.3922 + .7164147 × 4000 ± 2.0686576 × 506.85 × 3 q 1 25 + (4000−2843.944)2 24×3163.2822 Question 3 • reg lnq lnk Provide an interpretation of the coefficient of lnk in terms of elasticities. A 1% increase in capital is associated with a .7333548% increase in output. • Manually test at level 0.05 the claim that the coefficient of lnk equals 1. dis (.7333548 -1)/.0528022 -5.0498881 dis ttail(23, 5.0498881) .00002061 • reg lnq lnk lnl Are the regressors lnk and lnl jointly statistically significant at level 0.05? Yes. P rob > F = 0.0000 • Using STATA command test, test at level 0.05 whether returns to scale are constant. i.e. Test whether the coefficients of lnl and lnk sum to one. test lnk+ lnl =1 • gen lnk2 = lnk*lnk gen lnl2 = lnl*lnl gen lnlk = lnk*lnl reg lnq lnk lnl reg lnq lnk lnl lnk2 lnl2 lnlk Which model do you prefer? • reg lnq lnk lnl reg lnq lnk lnl lnk2 lnl2 lnlk Test whether lnk2 lnl2 lnlk are jointly statistically significant at level 0.05. F = (RSSr −RSSu )/q RSSu /(n−k) = (.698021161−.52472881)/3 .52472881/19 ≈ 2.0915913 dis Ftail(3,19, 2.0915913) .13519636 4 • How do results change compared to you use option vce(robust)? Question 4 • gen d1 = 1 if lotsize ==1 replace d1 =0 if d1==. gen d2 = 1 if lotsize ==2 replace d2 =0 if d2==. gen d3 = 1 if lotsize ==3 replace d3 =0 if d3==. • reg price size lotsize • reg price size reg price size d2 d3 dis ((1.4975e+10 -1.4763e+10 )/2)/( 1.4763e+10 /25) .17950281 dis Ftail(2,25, .17950281) .83675316 • reg price size lotsize reg price size d2 d3 Which one do you prefer? • reg price size d1 d2 reg price size d2 d3 What happened? • reg price size d1 d2 reg price size d2 d3 What happened? Coefficients and standard errors and summary statistics unchanged except for the dummies. • reg price size d1 d2 lotsize What happened? One of the regressors is dropped due to perfect collinearity. 5
