Quick ideas for using Digimap for Schools Geography teaching
advertisement

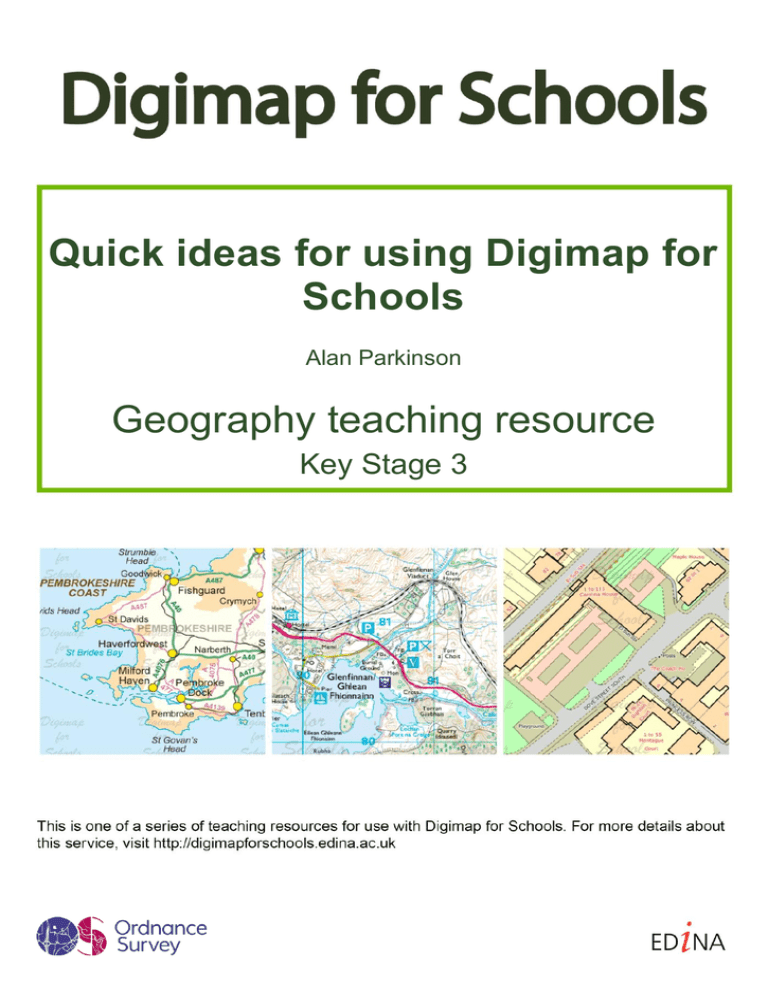
Quick ideas for using Digimap for Schools Alan Parkinson Geography teaching resource Key Stage 3 http://digimapforschools.edina.ac.uk Digimap for Schools Geography Resources These resources are a guide for teachers to demonstrate to the whole class or direct individual students as appropriate. Each activity has several ideas within it that you can tailor to suit your class and pupils. Some resources contain worksheets for direct distribution to pupils. 12 quick classroom or homework ideas (Secondary) Here are some quick ideas for using Digimap for Schools. These are all designed to be used EITHER with an area of mapping shown on a whiteboard and manipulated on screen, OR using a printed maps from Digimap for Schools as hand-outs when computers are not available or as a homework exercise. 1 What could the area that is shown on your map extract have looked like in the past? Look for clues in place names and the existence of certain symbols. 2 Imagine you are an estate agent looking to market properties in the area. What are its good features and what might the estate agent avoid mentioning to prospective buyers? 3 Print out a map and stick it onto a piece of thick card. Cut it out to create a jigsaw puzzle, and challenge another student to piece it back together, and identify the location that is being shown. Which map scale did you choose and why? 4 Use maps of a local area to complete one or more of these activities that encourage creative investigation of the local area www.missionexplore.net/reward/Mapping_badge. 5 Look at the area within 4 km of your house. Can you identify anything on the map that you didn’t realise was there before? Go and visit this place. 6 (Online only) Using the Search, can we find a place that has the biggest number of variations or examples across GB? Example high score is Newtown with 11. 7 Provide a map of a single grid square and ask students to use it to inspire some Tweets (140 characters or less) from the people who live there. Alternatively, suggest a Facebook update that the residents might post. 8 Imagine that your area was not in the GB, but was in America (or another country of your choice, perhaps one that the students have studied at key stage 2 or 3) – what differences would you notice in the nature of the area that could be shown on the map? 9 How might the area shown in the map extract change over the next 10, 20, 50 or 100 years? Is there evidence of changes that have not been mapped yet? 10 Ask students to imagine they are the teacher and can choose to take the class out for the afternoon to any place within 10 km of the school. Use the buffer tool to show this area as a transparent layer. Where would they take the class and why? D10877_secondary v1.0 Aug 2013 http://digimapforschools.edina.ac.uk 11 Overlay the National Grid on to a 1:50 000 scale map area showing a city edge. Using the Symbols tool (red pin) on the Annotations Toolbar, ask students to decide which grid squares on a map extract that they would class as urban and mark with a star. Choose another symbol for rural grid squares. Discuss geographical terms for the remaining squares. 12 Relocation: where would students reposition their school within GB if they could? Why are they choosing that place? Mark the suggested school locations in Digimap for Schools. Vote on the suggestions. If used as homework, ask students to annotate the map of that location with their reasons. These have been adapted from a list of ideas for using Ordnance Survey paper maps originally created by Katherine Hutchinson, Head of Humanities at Chesterton Community College, Cambridge. © EDINA at University of Edinburgh 2013 This work is licensed under a Creative Commons Attribution-Non Commercial License D10877_secondary v1.0 Aug 2013


