Insertion Loss Characteristics of Barriers and Berms 121 -
advertisement

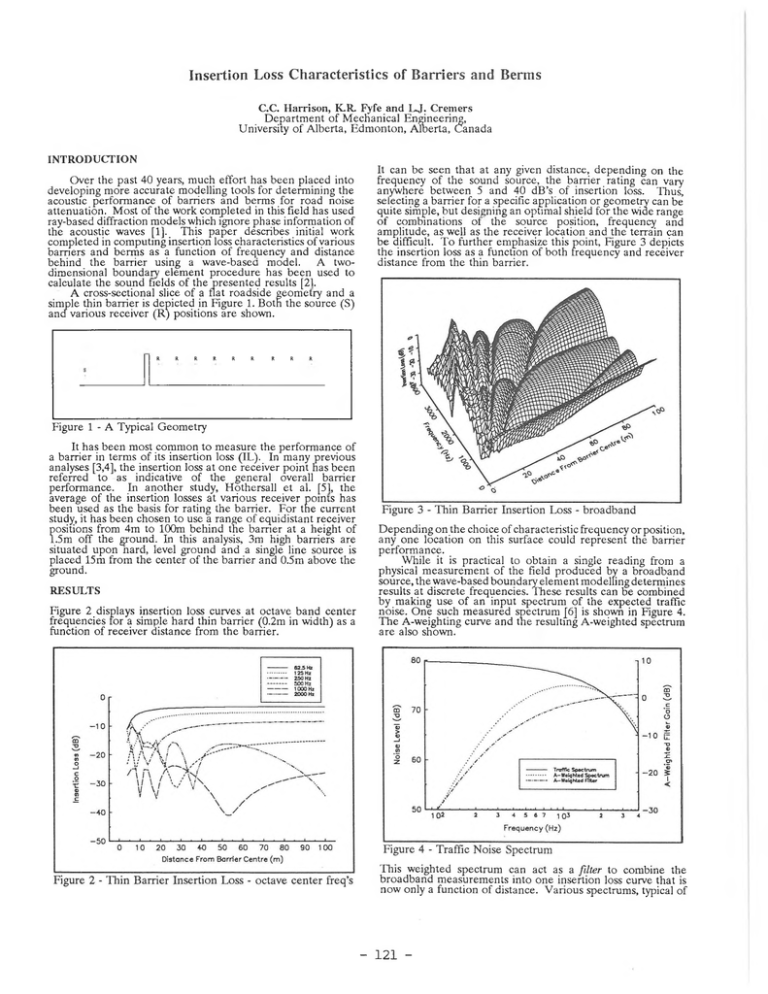
Insertion Loss Characteristics of Barriers and Berms C.C. Harrison, K.R. Fyfe and LJ. Cremers D e p a rtm e n t o f M ech an ical E ngineering, U niversity o f A lb erta, E d m o n to n , A lb e rta, C a n a d a INTRODUCTION It can b e seen th a t a t any given distance, d e p e n d in g on the frequency o f th e sou n d source, th e b a rrie r rating can vary anyw here b etw een 5 an d 40 d B ’s o f insertion loss. T hus, selecting a b a rrie r for a specific app licatio n o r g eo m etry can be q u ite sim ple, b u t designing an optim al shield for th e wide ran g e o f co m binatio ns o f th e so u rce position, frequency and a m p litud e, as well as th e receiver location a n d th e te rrain can b e difficult. T o fu rth e r em phasize this p oint, Figure 3 depicts th e insertion loss as a fu nction o f b o th freq uency an d receiver distance from th e thin barrier. O v er th e p ast 40 years, m u c h effort has b e e n pla ced into developing m o re a cc u ra te m odelling to o ls for d e term in in g the acoustic p e rfo rm a n c e o f b arriers a nd b e rm s fo r ro a d noise a tten u atio n . M o st o f th e w ork c o m p le ted in this field has used ray-based diffraction m odels which ig n ore p h a se in form ation o f th e acoustic w aves [1]. T his p a p e r describes initial w ork co m pleted in co m p u tin g insertion loss characteristics o f various b anners a n d b e rm s as a function o f frequ en cy a n d distance b eh in d th e b a rrie r using a w ave-basea m odel. A twodim ensional b o u n d a ry e le m e n t p ro c e d u re h as b e e n used to calculate th e so u n d fields o f the p r e s e n te d results [21. A cross-sectional slice o f a flat ro ad sid e g eo m etry a nd a simple thin b a rrie r is d ep icted in Figure 1. B o th th e so urce (S) and various receiv er (R ) positions are shown. R R R R R R R R R Figure 1 - A Typical G eo m etry It h a s b e e n m ost co m m o n to m e a su re th e p e rfo rm a n c e o f a b a rrie r in te rm s o f its insertion loss (IL). In m any p re v io u s analyses [3,4], th e insertion loss a t o n e receiver p o in t has b e en referred to as indicative o f th e g en e ral overall b arrier p erfo rm an ce. In a n o th e r study, H o th ersall e t al. [51, the average o f th e insertion losses a t various receiver p o in ts has b een used as th e basis for rating th e b a rrie r. F o r th e c u rre n t study, it h as b e e n c h osen to use a ran g e o f eq u id istan t receiver positions from 4m to 100m b e h in d th e b arrier a t a height o f l.5 m o ff th e grou n d . In this analysis, 3m high b arriers are situated u p o n n ard , level g ro u n d a n d a single line so urce is p la ced 15m from th e ce n te r o f th e b a rrie r an d 0.5m above the g round. D e p e n d in g o n th e choice o f characteristic frequ en cy o r position, any o n e lo catio n o n this surface could re p r e s e n t th e b arrier p erfo rm an ce. W hile it is practical to o b ta in a single re a d in g from a physical m e a s u re m e n t o f th e field p ro d u c e d by a b ro a d b a n d source, th e w ave-based b o u n d a ry e le m e n t m odelling determ ines results a t d iscrete frequencies. T h e se results can b e com bined by m aking u se o f an in p u t sp ectru m o f th e expected traffic noise. O n e such m e a su re d sp ectru m J6] is show n in Figure 4. T h e A -weighting curve a n d th e resulting A -w eighted spectrum a re also shown. RESULTS Figure 2 displays insertion loss curves a t octave b a n d c en te r frequencies for a simple h a rd thin b a rrie r (0.2m in w idth) as a function o f receiv er distance from th e barrier. T h is w eighted sp ectru m can a ct as a filte r to co m bine the b ro a d b a n d m e a su re m e n ts into o n e insertion loss curve th a t is now only a fu n ctio n o f d istance. V ario u s spectrum s, typical o f - 121 - different traffic configurations, could also be tested to evaluate the barrier or berm perform ance. Working with a single insertion loss curve, as a function of distance for each b am er, the selection o f a particular barrier is now simplified. T o take this one step further, various schemes are now being investigated to com bine or integrate the insertion losses at the receiver positions. In this way a single insertion loss param eter could be used to quantify th e barrier's perform ance. In addition to the simple thin barrier, various shapes of barriers and berms have b een modelled. Figure 5 shows some of the familiar barrier shapes. In addition to the insertion loss curves presented, sound level contour plots can be used for a quick and accurate visual comparison o f fields with and without a barrier. Figure 7, for example, depicting a raised road geometry, is included as an example o f these modelling capabilities. Sound levels, for this 500 Hz test, range from lOOaB n ea r the vehicles to 50dB in the shadow regions. Ongoing studies are investigating the application o f absorbative linings to both the barriers and on the ground surfaces in the shadow region of the barrier. As well, the effect o f various road-side geom etries on the perform ance o f the barriers are being studied. ACKNOWLEDGEMENTS The authors would like to acknowledge the support o f N SER C and C M H C in the partial funding o f this work. Thanks also to NIT, Belgium for use o f the SYSN OISE program. REFERENCES [1] Fyfe, K.R., H arrison, C.C., "Acoustic Perform ance of Barriers and Berms for R oad Noise A ttenuation", T o be published by CM H C , Dec. ’94 To com pare these barriers, insertion loss curves are presented at a frequency o f 500 Hz. Several national agencies [7,8] use an insertion loss curve at 500 Hz to be representative of a broadband insertion loss curve. The results o f this test are shown Figure 6. T h e results show that the straight and T ’ shaped barriers are superior by about 3dB over most o f the frequency range. M ore work is planned to investigate optimal barrier and berm geom etries for various road configurations. [2] SYSN OISE U ser’s M anual, N IT Belgium, 1994. [3] D A .H utchins, H .W Jo n e s and L.T.Russell, "Model Studies of Barrier Perform ance in the P resence o f G round Surfaces. Part I - Thin Perfectly Reflecting Barriers," Jvlcoust.Soc^Am. 75 (6), 1807-1816 (1984) [41 K.B.Rasmussen, "Sound P ropagation O ver Grass Covered Ground," J.Sound and Vibration 78 (2) 247-255 (1981) [5] D .C.Hothersall, S.N.Chandler-W ilde and M.N. Hajmirzae, "Efficiency o f Single Noise Barriers," /. Sound and Vibration 146 (2), 303-322 (1991) [6] P.T.Lewis, "The Noise G en erated By Single Vehicles in Freely Flowing Traffic," J.Sound and Vibration 30 (2) 207220 (1973) [7] C anada M ortgage and H ousing C orporation, "Road and Rail Noise: Effects on Housing," R ep ort No. N H A 5156 (1981) [8] D is ta n c e F ro m B arrier C en tre ( m ) International S tandard Organization, "Acoustics A ttenuation o f Sound D uring Propagation O utdoors - Part 2: A G eneral M ethod o f Calculation, R e p o rt No. ISO/D IS 9613-2 (1992) Figure 6 - Insertion Losses o f V arious Barrier Shapes Figure 7 - Sound Pressure C ontours for Raised Highway with Barriers - 122 -

