Time Picking on Noisy Microseismograms
advertisement

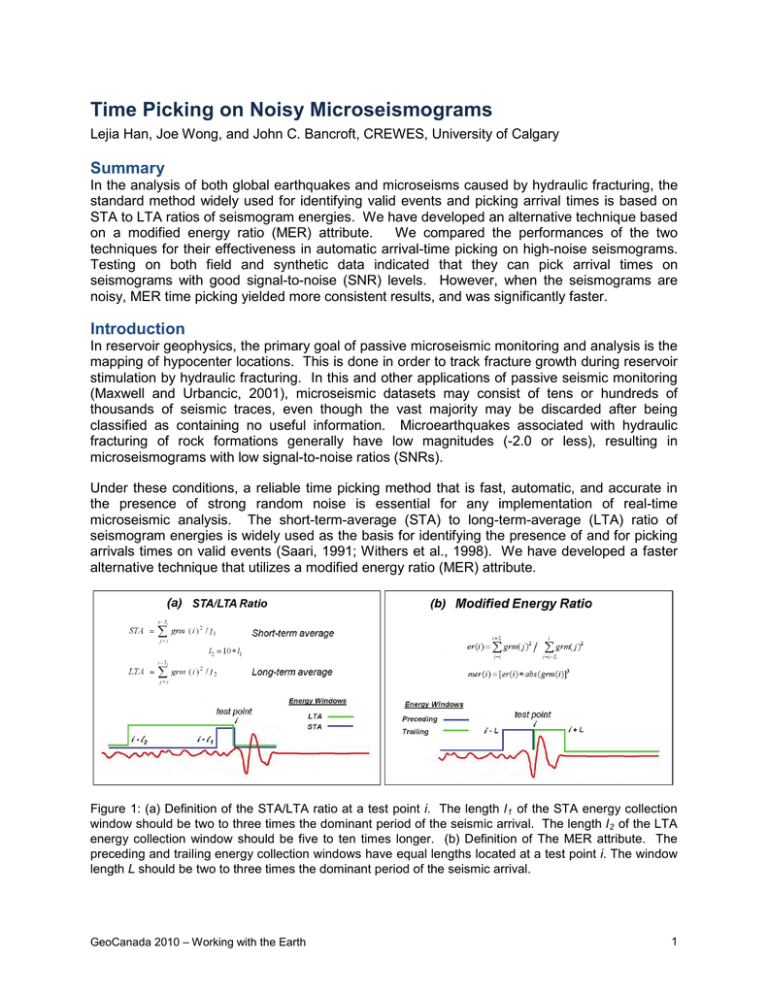
Time Picking on Noisy Microseismograms Lejia Han, Joe Wong, and John C. Bancroft, CREWES, University of Calgary Summary In the analysis of both global earthquakes and microseisms caused by hydraulic fracturing, the standard method widely used for identifying valid events and picking arrival times is based on STA to LTA ratios of seismogram energies. We have developed an alternative technique based on a modified energy ratio (MER) attribute. We compared the performances of the two techniques for their effectiveness in automatic arrival-time picking on high-noise seismograms. Testing on both field and synthetic data indicated that they can pick arrival times on seismograms with good signal-to-noise (SNR) levels. However, when the seismograms are noisy, MER time picking yielded more consistent results, and was significantly faster. Introduction In reservoir geophysics, the primary goal of passive microseismic monitoring and analysis is the mapping of hypocenter locations. This is done in order to track fracture growth during reservoir stimulation by hydraulic fracturing. In this and other applications of passive seismic monitoring (Maxwell and Urbancic, 2001), microseismic datasets may consist of tens or hundreds of thousands of seismic traces, even though the vast majority may be discarded after being classified as containing no useful information. Microearthquakes associated with hydraulic fracturing of rock formations generally have low magnitudes (-2.0 or less), resulting in microseismograms with low signal-to-noise ratios (SNRs). Under these conditions, a reliable time picking method that is fast, automatic, and accurate in the presence of strong random noise is essential for any implementation of real-time microseismic analysis. The short-term-average (STA) to long-term-average (LTA) ratio of seismogram energies is widely used as the basis for identifying the presence of and for picking arrivals times on valid events (Saari, 1991; Withers et al., 1998). We have developed a faster alternative technique that utilizes a modified energy ratio (MER) attribute. Figure 1: (a) Definition of the STA/LTA ratio at a test point i. The length l 1 of the STA energy collection window should be two to three times the dominant period of the seismic arrival. The length l 2 of the LTA energy collection window should be five to ten times longer. (b) Definition of The MER attribute. The preceding and trailing energy collection windows have equal lengths located at a test point i. The window length L should be two to three times the dominant period of the seismic arrival. GeoCanada 2010 – Working with the Earth 1 The STA/LTA and MER Time Picking Methods Figure 1(a) shows the definitions for the short-term average to long-term average (STA/LTA) ratio (Chen and Stewart, 2005; Munro, 2004). Figue1(b) shows the definition of the modified energy ratio (MER). Both attributes are based on energy ratio calculations, differing only on the lengths and positions of energy-collecting windows at each test point. For the STA/LTA method, the time pick occurs at the maximum of the rising slope of the ratio. For the MER method, the time pick occurs at the peak of the MER attribute. On Figure 2, we have plotted the STA/LTA ratio and MER for low-noise and high-noise signals. For high SNR arrivals, both techniques yield arrival times very close to the first-break time. For signals with low SNR, the picks for both methods occur somewhat later and closer to a peak or a trough. Figure 2: STA/LTA and MER time-picking (a) on a clean trace, and (b) on a noisy trace. The noisy trace (SNR=3) was created by adding Gaussian random noise to the clean trace (SNR=100). Testing on Field Seismograms Figure 3 compares MER and STA/LTA time picks for field seismograms recorded with an array of twelve 3C geophones spaced 11.75m apart in an observation well. The seismograms were generated by a casing perforation shot at a depth of 2150m in a treatment well located about 575m from the observation well. Synthetic random noise was added to give SNRs of about 3. Figure 3: MER and STA/LTA time picks (red triangles) for noisy 3C field microseismograms. Vertical component traces are shown in red; horizontal component traces are shown in blue. GeoCanada 2010 – Working with the Earth 2 The picks using the MER method appear to be more consistent and accurate than the STA/LTA picks. In this test, the MER method was almost five times faster than the STA/LTA method, due to the fact that the LTA energy window is much longer than the MER energy windows. Testing on Synthetic Seismograms Gathers of synthetic microseismograms were created to represent recordings by a microseismic monitoring system (an array of fifteen geophones spaced vertically at 50m in an observation well at a distance of 500m from the microseismic source). Various levels of Gaussian random noise were added in order to study the limitations on the time picking methods caused by noise. Figure 4: Time picking of multiple noisy arrivals. (a) SNR=3.5; (b) SNR=2.5. Outliers in the time picks begin to appear for SNRs less than 3.5. Figure 5: Left: the red crosses are initial MER time picks, showing five outliers (circled crosses in red); the green crosses are the picks after 5-point median filtering. Right: repeated MER picks after applying a window (defined following the steps in the text) to eliminate the outliers. GeoCanada 2010 – Working with the Earth 3 Time Picking of Multiple Arrivals The ability of time picking software to correctly determine multiple arrivals on a seismic trace is important because a microseismogram will often contain both P and S arrivals. A modified version of the MER technique allows us to include picking of multiple arrivals. Figure 4 indicates how the modification handles multiple events for different noise levels. For SNRs greater than about 3.5, the arrival times for well-separated coherent events are picked accurately. For SNRs less than 3.5, outliers begin to appear. Time Picking on Extremely Noisy Traces When traces are extremely noisy, the MER time picks often have many outliers. This is the case for the picks on Figure 5 shown as red crosses. Five outlier picks are plotted within circles. Applying a 5-point median filter changes the picks to the green crosses and eliminates the worst outliers. However, the filtered picks are incorrect for many of the traces. These picks can be corrected after windowing the traces. Define the window in the following way. Let tmin and tmax be the minimum and maximum values of the median-filtered time picks. Estimate the dominant period T of the seismic arrival. Let t1 be a value in the range 2T to 4T. Set the leading edge of the window at (tmin - t1) and the trailing edge at (tmax + t1). Re-pick after windowing. Repeat the process of median filtering, windowing, and re-picking if necessary. The right side of Figure 5 shows the results after applying this repicking procedure twice. The picks are correctly placed on all the arrivals, even though the noise levels are very high (SNR=1.5). Conclusion Both the STA/LTA and MER techniques work well for microseismograms with good signal-tonoise ratios. However, when SNRs are less than 3.5, the MER method is more accurate and gives more consistent arrival times. For groups of very noisy seismograms (SNR=1.5), repeated applications of picking, median filtering, windowing, and re-picking may be required to get accurate arrival times. The position and length of a suitable window are obtained by analyzing the arrival times from an initial application of MER picking. Acknowledgements We express our gratitude to NSERC and the industrial sponsors of CREWES for supporting this research. The perforation shot field seismograms were provided by Talisman Energy Inc. References Chen, Z. and Stewart, R., 2005, Multi-window algorithm for detecting seismic first arrivals: Abstracts, CSEG 2005 National Convention, 355-358. Maxwell, S. C. and Urbancic, T. I., 2001. The role of passive microseismic monitoring in the instrumented oilfield: The Leading Edge, 20, 636-639. Munro, K.A., 2004. Automatic event detection and picking P-wave arrivals: CREWES Research Report 18, 12.112.10. Saari, J., 1991. Automated phase picker and source location algorithms for local distances using a single three-component seismic station, Tectonophysics, 189, 307-315. Withers, M, Aster, R., Young, C., Beiriger, J., Harris, M., Moore, S., and Trujillo, J., 1998. A comparison of selected trigger algorithms for automated global seismic phase and event detection, Bull. Seismological Soc. Am., 88, 95-106. GeoCanada 2010 – Working with the Earth 4


