is defined in Rea (8) as the wavelength of a monochromatic source
advertisement

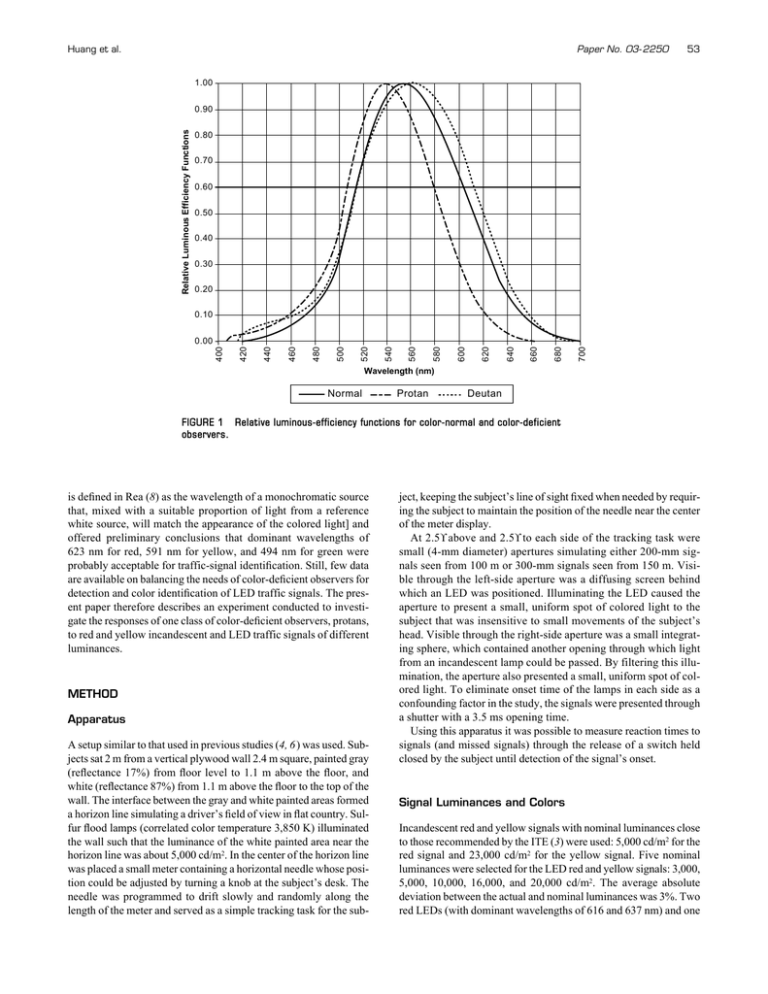
Huang et al. Paper No. 03- 2250 53 1.00 Relative Luminous Efficiency Functions 0.90 0.80 0.70 0.60 0.50 0.40 0.30 0.20 0.10 700 680 660 640 620 600 580 560 540 520 500 480 460 440 420 400 0.00 Wavelength (nm) Normal Protan Deutan FIGURE 1 Relative luminous-efficiency functions for color-normal and color-deficient observers. is defined in Rea (8) as the wavelength of a monochromatic source that, mixed with a suitable proportion of light from a reference white source, will match the appearance of the colored light] and offered preliminary conclusions that dominant wavelengths of 623 nm for red, 591 nm for yellow, and 494 nm for green were probably acceptable for traffic-signal identification. Still, few data are available on balancing the needs of color-deficient observers for detection and color identification of LED traffic signals. The present paper therefore describes an experiment conducted to investigate the responses of one class of color-deficient observers, protans, to red and yellow incandescent and LED traffic signals of different luminances. METHOD Apparatus A setup similar to that used in previous studies (4, 6) was used. Subjects sat 2 m from a vertical plywood wall 2.4 m square, painted gray (reflectance 17%) from floor level to 1.1 m above the floor, and white (reflectance 87%) from 1.1 m above the floor to the top of the wall. The interface between the gray and white painted areas formed a horizon line simulating a driver’s field of view in flat country. Sulfur flood lamps (correlated color temperature 3,850 K) illuminated the wall such that the luminance of the white painted area near the horizon line was about 5,000 cd/m2. In the center of the horizon line was placed a small meter containing a horizontal needle whose position could be adjusted by turning a knob at the subject’s desk. The needle was programmed to drift slowly and randomly along the length of the meter and served as a simple tracking task for the sub- ject, keeping the subject’s line of sight fixed when needed by requiring the subject to maintain the position of the needle near the center of the meter display. At 2.5° above and 2.5° to each side of the tracking task were small (4-mm diameter) apertures simulating either 200-mm signals seen from 100 m or 300-mm signals seen from 150 m. Visible through the left-side aperture was a diffusing screen behind which an LED was positioned. Illuminating the LED caused the aperture to present a small, uniform spot of colored light to the subject that was insensitive to small movements of the subject’s head. Visible through the right-side aperture was a small integrating sphere, which contained another opening through which light from an incandescent lamp could be passed. By filtering this illumination, the aperture also presented a small, uniform spot of colored light. To eliminate onset time of the lamps in each side as a confounding factor in the study, the signals were presented through a shutter with a 3.5 ms opening time. Using this apparatus it was possible to measure reaction times to signals (and missed signals) through the release of a switch held closed by the subject until detection of the signal’s onset. Signal Luminances and Colors Incandescent red and yellow signals with nominal luminances close to those recommended by the ITE (3) were used: 5,000 cd/m2 for the red signal and 23,000 cd/m2 for the yellow signal. Five nominal luminances were selected for the LED red and yellow signals: 3,000, 5,000, 10,000, 16,000, and 20,000 cd/m2. The average absolute deviation between the actual and nominal luminances was 3%. Two red LEDs (with dominant wavelengths of 616 and 637 nm) and one

