An Ultrasonic Method for Testing Spot
advertisement
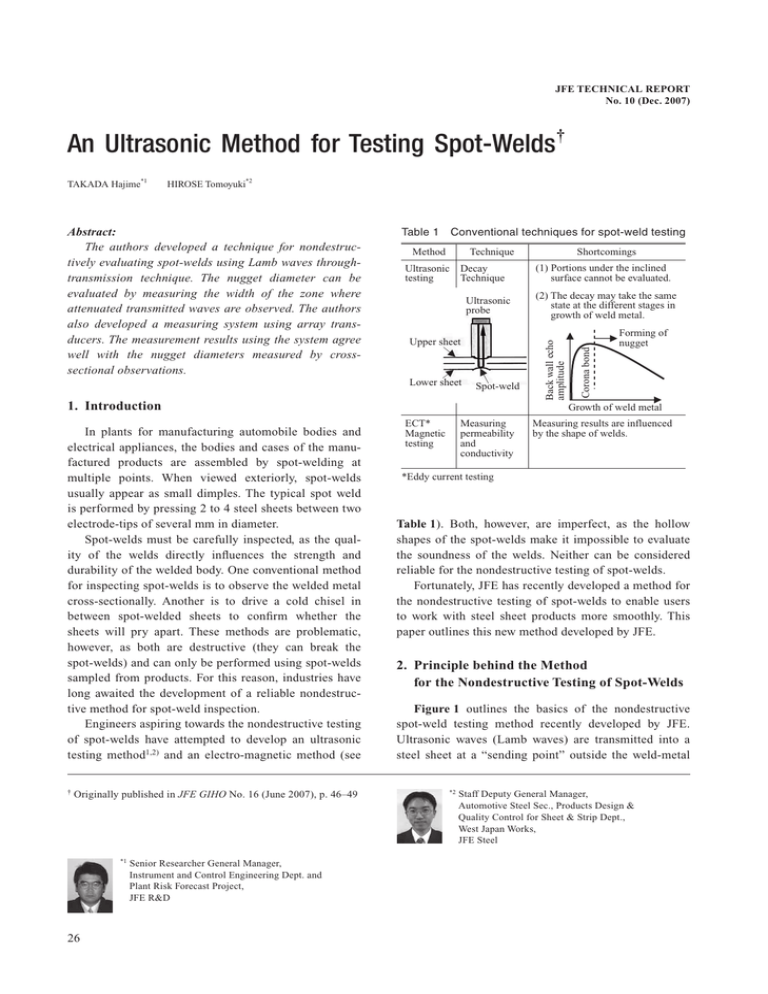
JFE TECHNICAL REPORT No. 10 (Dec. 2007) An Ultrasonic Method for Testing Spot-Welds† HIROSE Tomoyuki*2 Table 1 Conventional techniques for spot-weld testing Method Technique Ultrasonic testing Decay Technique Ultrasonic probe Upper sheet Lower sheet Spot-weld 1. Introduction In plants for manufacturing automobile bodies and electrical appliances, the bodies and cases of the manufactured products are assembled by spot-welding at multiple points. When viewed exteriorly, spot-welds usually appear as small dimples. The typical spot weld is performed by pressing 2 to 4 steel sheets between two electrode-tips of several mm in diameter. Spot-welds must be carefully inspected, as the quality of the welds directly influences the strength and durability of the welded body. One conventional method for inspecting spot-welds is to observe the welded metal cross-sectionally. Another is to drive a cold chisel in between spot-welded sheets to confirm whether the sheets will pry apart. These methods are problematic, however, as both are destructive (they can break the spot-welds) and can only be performed using spot-welds sampled from products. For this reason, industries have long awaited the development of a reliable nondestructive method for spot-weld inspection. Engineers aspiring towards the nondestructive testing of spot-welds have attempted to develop an ultrasonic testing method1,2) and an electro-magnetic method (see † Originally published in JFE GIHO No. 16 (June 2007), p. 46–49 *1 26 Senior Researcher General Manager, Instrument and Control Engineering Dept. and Plant Risk Forecast Project, JFE R&D Shortcomings (1) Portions under the inclined surface cannot be evaluated. (2) The decay may take the same state at the different stages in growth of weld metal. Corona bond Abstract: The authors developed a technique for nondestructively evaluating spot-welds using Lamb waves throughtransmission technique. The nugget diameter can be evaluated by measuring the width of the zone where attenuated transmitted waves are observed. The authors also developed a measuring system using array transducers. The measurement results using the system agree well with the nugget diameters measured by crosssectional observations. Back wall echo amplitude TAKADA Hajime*1 Forming of nugget Growth of weld metal ECT* Magnetic testing Measuring permeability and conductivity Measuring results are influenced by the shape of welds. *Eddy current testing Table 1). Both, however, are imperfect, as the hollow shapes of the spot-welds make it impossible to evaluate the soundness of the welds. Neither can be considered reliable for the nondestructive testing of spot-welds. Fortunately, JFE has recently developed a method for the nondestructive testing of spot-welds to enable users to work with steel sheet products more smoothly. This paper outlines this new method developed by JFE. 2. Principle behind the Method for the Nondestructive Testing of Spot-Welds Figure 1 outlines the basics of the nondestructive spot-weld testing method recently developed by JFE. Ultrasonic waves (Lamb waves) are transmitted into a steel sheet at a “sending point” outside the weld-metal *2 Staff Deputy General Manager, Automotive Steel Sec., Products Design & Quality Control for Sheet & Strip Dept., West Japan Works, JFE Steel An Ultrasonic Method for Testing Spot-Welds Transmitter Receiver Scanning Distance between transmitter and receiver: Constant Ultrasound (Lamb wave) y x Ultrasound Steel sheet Ultrasound Transmitter Nugget Receiving point Incident point Steel sheet Fig. 1 Water Evaluation method by use of ultrasound (Lamb wave) of a spot-weld (nugget), and through-transmitted waves are received at a “receiving point” opposite to the sending point. As a dendrite structure with low transmissivity for ultrasonic waves (large attenuation) exists in the nugget, the ultrasonic waves propagating along the surface of the steel sheet are attenuated proportionately with the nugget diameter. The attenuation of ultrasonic waves can be altered by the scattering of ultrasound resulting from the step-like shape formed in a spot-weld. Yet ultrasonic waves propagate in many propagation modes along a steel sheet. For this reason, the use of a propagation mode with large particle displacement near the thickness center of the sheet will minimize the influence of the step-like shape on the propagation. Ultrasound (Lamb wave) Fig. 2 The accuracy of the measurement of the ultrasound attenuation depends on the coupling between the ultrasonic probe and the test object. With this in mind, the authors decided to study a testing technique in which the nugget diameter is evaluated by detecting the planar zone where the nugget-induced attenuation of the ultrasound is observed. 20 mm Test method in laboratory experiment Locus of incident points Locus of receiving points x y Fig. 3 Ultrasound Loci of incident and receiving points on the specimen Table 2 3. Study on Spot-Weld Evaluation Using an Immersion Testing Method Receiver Test specimens Welding Current Sample number Set (kA) Measured (kA) P2 6.0 6.12 5.15 2.4 P4 6.5 6.68 4.99 3.9 P6 7.0 7.06 5.02 4.1 P8 7.5 7.55 4.96 5.0 P10 8.0 7.97 4.88 6.2 P12 8.5 8.45 4.68 6.5 P14 9.0 8.98 4.21 8.2 Thickness of Diameter of weld (mm) nugget (mm) 3.1 Experimental Method The testing technique mentioned above could be evaluated by an immersion testing method effective in removing the influence of changes in the coupling. As shown in Fig. 2, 2-dimensional maps of the through-transmitted wave amplitude were prepared by 2-dimensional scanning of a pair of ultrasonic immersion probes consisting of an ultrasound (Lamb wave) transmitter and receiver. Figure 3 shows the loci of the ultrasound sending point and receiving point on the test object. The maps obtained were compared with each other, and the appropriate measuring condition was elucidated. The spot-welded samples shown in Table 2 were used as the test objects. The samples were prepared by stacking and spot-welding two steel sheets with a thickness of 2.6 mm each. The nugget diameters were varied JFE TECHNICAL REPORT No. 10 (Dec. 2007) by adjusting the weld current. Two samples were made under identical conditions at every welding current. One (test sample) was used for the ultrasonic measurement and the other (reference sample) was sectioned for the measurement of the nugget diameter. The measured nugget diameters are shown in the rightmost column of Table 2. 3.2 Results and Spot-Weld Evaluation Method Derived from Them Figure 4 shows an example of the amplitude map of the through-transmitted waves. The amplitude is represented by modulations of brightness (representation using a gray scale). Waves received with large amplitudes are depicted as bright portions. The waves received 27 An Ultrasonic Method for Testing Spot-Welds Amplitude Ultrasound Spot-weld 5 mm Scanning y y Spot-weld Ultrasound x Attenuation band x Receiver Transmitter Attenuation band width: Proportional to the nugget diameter Fig. 4 An attenuation band in C-scope Attenuation band width (mm) Fig. 6 Fig. 5 9 8 7 6 5 4 3 2 1 0 Evaluation of the nugget diameter by probe scanning developed a method for scanning the ultrasonic beams linearly using piezoelectric element arrays. 4.1 Prototype Measuring System Using Piezoelectric Element Array 0 1 2 3 4 5 6 7 Nugget diameter (mm) 8 9 Relation between attenuation band widths and nugget diameters are attenuated in the black portion observed in the center of the map. The black portion observed in the 2-dimensional amplitude map obtained through the measurement of waves transmitted through the spot-weld is referred to as an “attenuation band” in the rest of this paper. The width of the attenuation band (the “attenuation bandwidth”) obtained through the measurement of the test sample was compared with the nugget diameter measured by sectioning the paired reference sample (See Table 2). As shown in Fig. 5, the experiment indicated a high correlation between the attenuation bandwidths and the nugget diameters. It also indicated that the attenuation bandwidths agreed with the nugget diameters to a precision of about 0.4 mm. There was no correlation between the attenuation bandwidths and the sizes (diameters and depths) of the dimples in the spot-welds. On the basis of these results, we expected to determine the nugget diameter by measuring the width of the low-amplitude portion in the scanning echo-graph obtained by linear scanning of the coupled ultrasonic probes (transmitter/receiver). The appearance of a prototype measuring system is shown in Photo 1. Switching circuits interposed between the ultrasonic pulser/receiver and the probe arrays (piezoelectric element arrays) switch the connections between the piezoelectric elements in the probe array and the ultrasonic pulser/receiver. All the received signals are subjected to A/D conversion and are handled by a personal computer (PC). The amplitudes of the through-transmitted ultrasonic waves received within the set time range of flight are detected and displayed using a signal-processing application on a PC. Photo 2 shows the appearance of the coupled piezoelectric element arrays. The transmitting probe array Switching unit PC A/D converter Ultrasonic Pulser/Receiver Photo 1 Probe array Developed measuring system Coupled 4. Spot-Weld Evaluation Method Using Piezoelectric Element Array and Prototype Measuring System The method shown in Fig. 6 requires the mechanical scanning of the coupled ultrasonic probes, a process unsuitable for the nondestructive spot-weld evaluation in a manufacturing plant. As an alternative, the authors 28 Photo 2 A transmitting probe array and a receiving probe array coupled together JFE TECHNICAL REPORT No. 10 (Dec. 2007) An Ultrasonic Method for Testing Spot-Welds and receiving probe array are both equipped with a piezoelectric element array. Each array is composed of 8 piezoelectric elements with a nominal frequency of 5 MHz, a width of 1.5 mm in the array direction, and an element spacing of 0.1 mm in the array direction. The system works via the measurement of the amplitude of the through-transmitted wave moving between every element in the transmitting probe array and every element in the receiving probe array. As shown in Fig. 7, the through-transmitted wave transmitted from the piezoelectric element i (i=1, 2, …, 8) in the transmitting probe array is received by all of the piezoelectric elements in the receiving probe array. The amplitudes of the through-transmitted waves moving along the paths mentioned above are detected. In other words, the amplitudes of the through-transmitted waves that take the oblique path are also detected. The amplitudes of the through-transmitted waves measured are shown in a representation using a matrix. The brightness of each element indicated in the matrix is modulated according to the amplitude of the throughtransmitted wave, where a bright element indicated Receiving piezoelectric element array Receiving 1 2 3 4 5 6 7 8 1 2 3 4 5 6 7 8 4.2 Performance of the Prototype Measuring System Figure 8 shows examples of the matrix display in the measurement of representative samples. The darkly colored elements running diagonally downward from the left to right correspond to the attenuation band. A larger nugget diameter (denoted as “ND” in Fig. 8) corresponds to a larger attenuation bandwidth. The attenuation bandwidth is measured using the amplitudes of the received through-transmitted waves transmitted by element i in the transmitting probe array and then received by element i in the receiving probe array (i = 1, 2, ..., 8). In other words, the amplitudes of the through-transmitted waves propagated between the piezoelectric elements facing each other are used. An Transmitting Transmitting piezoelectric element array shows that the through-transmitted wave received has a large amplitude. The matrix display can be used to determine the positional relation between the probe arrays and the spot-weld, as shown in Fig. 7. The positions of the probe arrays are easily adjusted to the spot-weld using the matrix display. The measurement time per spot-weld is less than 3 seconds. 1 2 3 4 5 6 7 8 1 2 3 4 5 6 7 8 (a) Corona bond Fig. 8 (b) ND: 2.3 mm (c) ND: 8.2 mm Examples of matrix display 1 2 3 4 5 6 7 8 1 2 3 4 5 6 7 8 Attenuation band width (mm) 8 1 2 3 4 5 6 7 8 1 2 3 4 5 6 7 8 Ultrasound Fig. 7 JFE TECHNICAL REPORT No. 10 (Dec. 2007) 6 5 4 3 2 1 0 1 Spot-weld Detection of miss-alignment by use of matrix display 7 Fig. 9 5 6 2 3 4 Nugget diameter (mm) 7 8 Relation between attenuation band widths measured using the system and nugget diameters 29 An Ultrasonic Method for Testing Spot-Welds amplitude profile of the received through-transmitted waves in the array direction was determined by interpolation using the amplitudes of the received throughtransmitted waves described above. Then the width of a portion where the amplitude was lower than a predetermined threshold value was measured as the attenuation bandwidth. Figure 9 shows the relation between the attenuation bandwidths measured using the above-mentioned method and the nugget diameters determined by an experiment using the samples shown in Table 2. The measured attenuation bandwidths agreed with the nugget diameters to a precision of about 0.5 mm. As a result, it was proved that the attenuation bandwidth can be displayed as the nugget diameter. (1) The nugget diameter can be evaluated by measuring the width of the zone where highly attenuated through-transmitted waves are observed. (2) The authors developed a measuring system using a piezoelectric element array. The results of measurements by this system were proven to agree well with the nugget diameters measured by cross-sectional observations. JFE is planning to develop a commercial measurement system based on the method mentioned above. Once developed, the system will be supplied to automakers and other users of steel sheet. References 5. Conclusions The authors developed a method for nondestructively evaluating spot-welds based on the measurement of ultrasound (Lamb wave) through-transmission waves. We report the following points. 30 1) The Japanese Society for Non-Destructive Inspection Ultrasonic Testing III. The Japanese Society for Non-Destructive Inspection. Tokyo, 2001, p. 235. (Japanese) 2) Matsushima, T. Proc JSNDI Fall Conf. 2001. p. 57–58. (Japanese) 3) Rose, J. L. Ultrasonic waves in solid media, Cambridge Univ. Press, Cambridge. 1999, p. 101–126. JFE TECHNICAL REPORT No. 10 (Dec. 2007)
