Panels: Mean vs. Max - Blog
advertisement

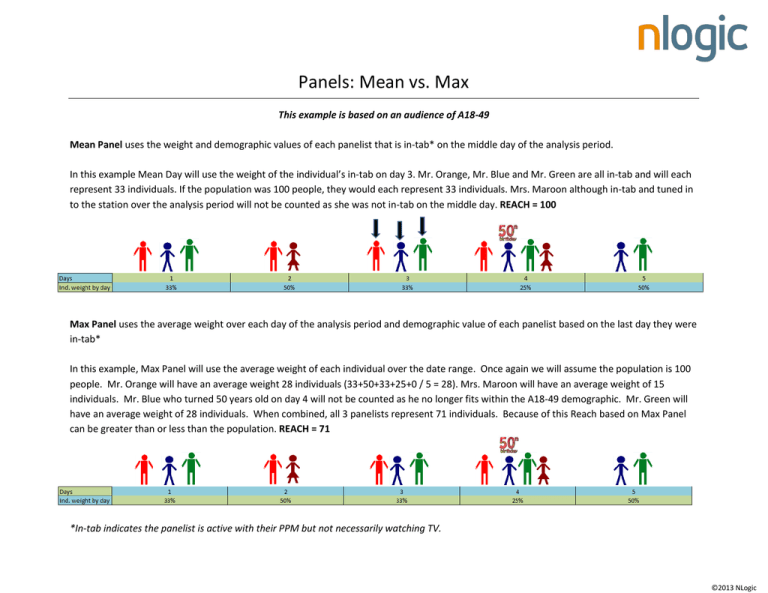
Panels: Mean vs. Max This example is based on an audience of A18-49 Mean Panel uses the weight and demographic values of each panelist that is in-tab* on the middle day of the analysis period. In this example Mean Day will use the weight of the individual’s in-tab on day 3. Mr. Orange, Mr. Blue and Mr. Green are all in-tab and will each represent 33 individuals. If the population was 100 people, they would each represent 33 individuals. Mrs. Maroon although in-tab and tuned in to the station over the analysis period will not be counted as she was not in-tab on the middle day. REACH = 100 Max Panel uses the average weight over each day of the analysis period and demographic value of each panelist based on the last day they were in-tab* In this example, Max Panel will use the average weight of each individual over the date range. Once again we will assume the population is 100 people. Mr. Orange will have an average weight 28 individuals (33+50+33+25+0 / 5 = 28). Mrs. Maroon will have an average weight of 15 individuals. Mr. Blue who turned 50 years old on day 4 will not be counted as he no longer fits within the A18-49 demographic. Mr. Green will have an average weight of 28 individuals. When combined, all 3 panelists represent 71 individuals. Because of this Reach based on Max Panel can be greater than or less than the population. REACH = 71 *In-tab indicates the panelist is active with their PPM but not necessarily watching TV. ©2013 NLogic

