Finger Lakes - New York State Homes and Community Renewal
advertisement

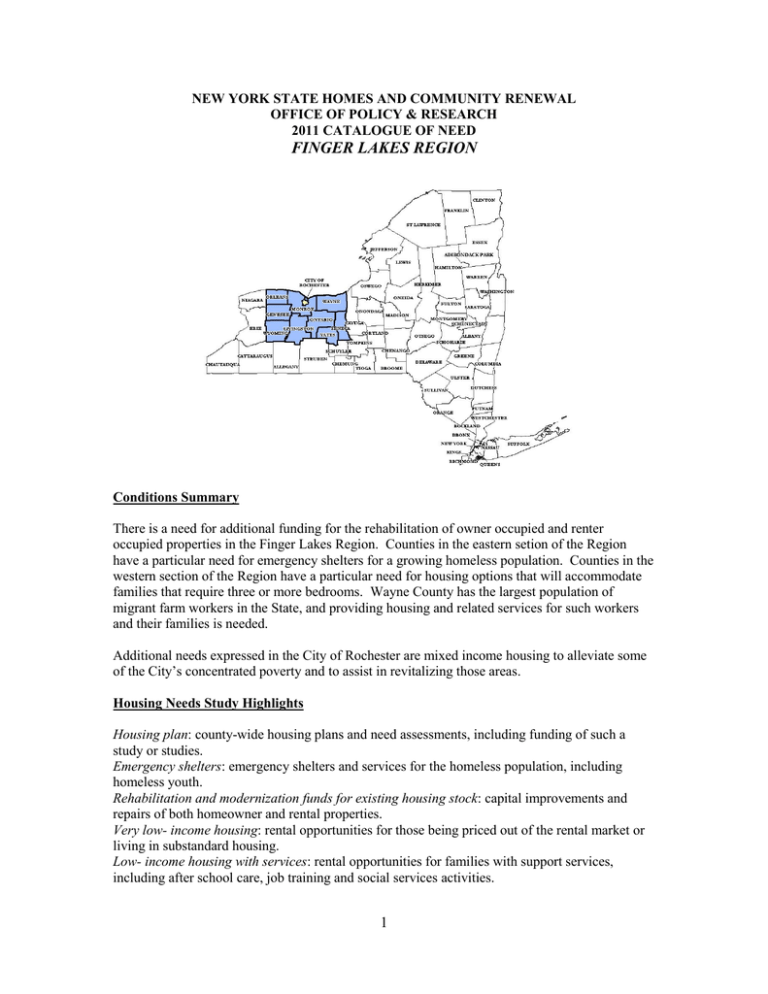
NEW YORK STATE HOMES AND COMMUNITY RENEWAL OFFICE OF POLICY & RESEARCH 2011 CATALOGUE OF NEED FINGER LAKES REGION Conditions Summary There is a need for additional funding for the rehabilitation of owner occupied and renter occupied properties in the Finger Lakes Region. Counties in the eastern setion of the Region have a particular need for emergency shelters for a growing homeless population. Counties in the western section of the Region have a particular need for housing options that will accommodate families that require three or more bedrooms. Wayne County has the largest population of migrant farm workers in the State, and providing housing and related services for such workers and their families is needed. Additional needs expressed in the City of Rochester are mixed income housing to alleviate some of the City’s concentrated poverty and to assist in revitalizing those areas. Housing Needs Study Highlights Housing plan: county-wide housing plans and need assessments, including funding of such a study or studies. Emergency shelters: emergency shelters and services for the homeless population, including homeless youth. Rehabilitation and modernization funds for existing housing stock: capital improvements and repairs of both homeowner and rental properties. Very low- income housing: rental opportunities for those being priced out of the rental market or living in substandard housing. Low- income housing with services: rental opportunities for families with support services, including after school care, job training and social services activities. 1 USDA Rural Housing Services 515 Program preservation funds: capital improvements and repairs for 515 projects. Larger units: three or more bedroom rental opportunities for families. Foreclosure prevention: funding for foreclosure prevention programs. Additional needs expressed in the City of Rochester are as follows: Vacant property rehabilitation and demolition: rehabilitate, preserve or demolish vacant and blighted properties. Mixed use and mixed income development: flexible funding to allow for mixed use and mixed income development. Genesee Livingston Monroe Ontario Orleans Seneca Wayne Wyoming Yates Total TABLE 1 - HOUSING REPORT CARD (2006-2010) Rental Rental Homeowner New Preservation Improvement Construction Units Units Units 158 43 504 148 24 533 4,670 1,276 3,517 1,179 272 324 81 34 327 158 68 301 132 196 456 125 48 513 24 0 238 6,675 1,961 6,713 Homebuyer Assistance Units 169 176 2,596 174 64 48 223 77 79 3,606 Note: The HRC records the affordable housing units assisted by programs administered by HCR, the New York State Office of Temporary Disability Assistance and the New York State Office of Mental Health. TABLE 2 - HCR AFFORDABLE HOUSING COVERAGE RATE # of Renters at Renter # of Owners at Homeowner 50% or Below Coverage 50% or Below of Coverage of AMI1 Rate AMI1 Rate Genesee 3,000 6.7% 2,290 29.4% Livingston 3,050 5.6% 2,365 30.0% Monroe 46,530 12.8% 25,010 24.4% Ontario 4,820 30.1% 3,440 14.5% Orleans 2,060 5.6% 2,130 18.4% Seneca 1,060 21.3% 1,295 26.9% Wayne 4,525 7.2% 4,350 15.6% Wyoming 1,235 14.0% 1,880 31.4% Yates 940 2.6% 1,100 28.8% Total 67,220 12.8% 43,860 23.5% Note: The HCR Affordable Housing Renter and Homeowner Coverage Rate is a way of measuring the proportion of low- income residents in a county impacted by HCR programs funded 2006-2010. 2 TABLE 3 - AMERICAN COMMUNITY SURVEY (2005-2009) % of % of % of % of % of % of Housing % of Median Individuals Units that Renters Owners Population Units Vacant Household Below are Severe Severe 62 Years Built Residential Income Poverty Renter Cost Cost and Over Before Addresses3 2 2 Level Occupied Burdened Burdened 1940 $48,200 11.1% 18.6% 26.4% 41.8% 24.3% 8.1% 1.8% $51,700 12.3% 15.5% 23.5% 34.8% 24.3% 9.0% 1.2% $51,100 13.1% 16.4% 32.7% 29.6% 28.7% 8.8% 3.4% $55,300 8.0% 17.6% 24.8% 32.5% 22.6% 7.5% 2.1% $46,400 12.7% 16.5% 23.9% 46.2% 21.2% 10.9% 2.6% $45,600 13.4% 18.0% 22.2% 36.6% 17.7% 8.0% 2.4% $52,400 11.0% 16.5% 23.1% 35.9% 25.8% 7.6% 1.4% $48,900 10.5% 15.7% 22.2% 47.3% 16.7% 8.4% 2.0% $44,900 13.0% 18.9% 23.2% 38.4% 11.4% 10.6% 1.5% Genesee Livingston Monroe Ontario Orleans Seneca Wayne Wyoming Yates Note: American Community Survey (ACS) data is survey-based and subject to sampling error. Since ACS variables change over time, some areas or subjects must be compared with caution, or not at all. CHART 1 PROJECTED POPULATION CHANGE4 14.0% 12.0% 10.0% 8.0% Projected Population Change 2010 to 2015 6.0% 4.0% Projected Population Change 2010 to 2015 (Ages 60+) 2.0% 0.0% -2.0% -4.0% 1 2009 HUD Comprehensive Housing Affordability Strategy (CHAS) Data Book. Severe cost burdened represents households spending more than 50 percent of their gross income on housing costs - 2009 HUD CHAS Data Book. 3 Quarter 3 2010 HUD Aggregated United States Postal Service Data on Address Vacancies. Percent of Vacant Residential Addresses for the Region’s largest city is as follows: Rochester – 7.5%. 4 Cornell University Program on Applied Demographics: Population Projections. 2 The full regional report(s) can be viewed at: http://nysdhcr.gov/Publications/HousingNeedsStudy/FingerLakes.pdf http://nysdhcr.gov/Publications/HousingNeedsStudy/FingerLakes_2009.pdf 3


