Photopic and Scotopic lumens - 3: The modern Lumen
advertisement
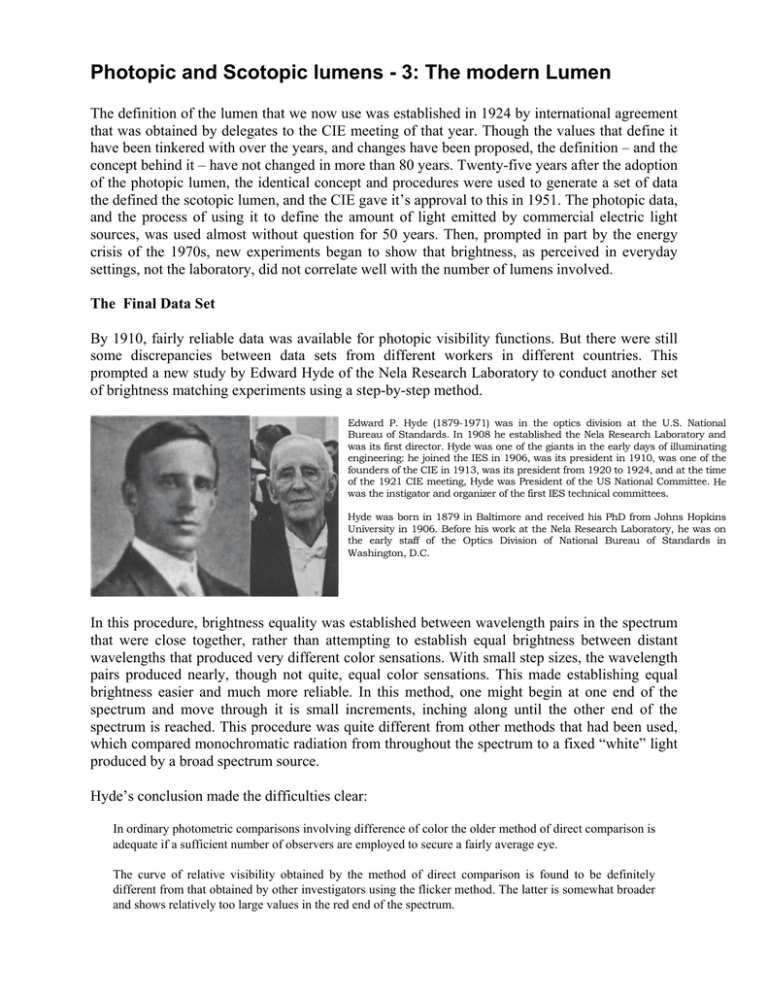
Photopic and Scotopic lumens - 3: The modern Lumen The definition of the lumen that we now use was established in 1924 by international agreement that was obtained by delegates to the CIE meeting of that year. Though the values that define it have been tinkered with over the years, and changes have been proposed, the definition – and the concept behind it – have not changed in more than 80 years. Twenty-five years after the adoption of the photopic lumen, the identical concept and procedures were used to generate a set of data the defined the scotopic lumen, and the CIE gave it’s approval to this in 1951. The photopic data, and the process of using it to define the amount of light emitted by commercial electric light sources, was used almost without question for 50 years. Then, prompted in part by the energy crisis of the 1970s, new experiments began to show that brightness, as perceived in everyday settings, not the laboratory, did not correlate well with the number of lumens involved. The Final Data Set By 1910, fairly reliable data was available for photopic visibility functions. But there were still some discrepancies between data sets from different workers in different countries. This prompted a new study by Edward Hyde of the Nela Research Laboratory to conduct another set of brightness matching experiments using a step-by-step method. Edward P. Hyde (1879-1971) was in the optics division at the U.S. National Bureau of Standards. In 1908 he established the Nela Research Laboratory and was its first director. Hyde was one of the giants in the early days of illuminating engineering: he joined the IES in 1906, was its president in 1910, was one of the founders of the CIE in 1913, was its president from 1920 to 1924, and at the time of the 1921 CIE meeting, Hyde was President of the US National Committee. He was the instigator and organizer of the first IES technical committees. Hyde was born in 1879 in Baltimore and received his PhD from Johns Hopkins University in 1906. Before his work at the Nela Research Laboratory, he was on the early staff of the Optics Division of National Bureau of Standards in Washington, D.C. In this procedure, brightness equality was established between wavelength pairs in the spectrum that were close together, rather than attempting to establish equal brightness between distant wavelengths that produced very different color sensations. With small step sizes, the wavelength pairs produced nearly, though not quite, equal color sensations. This made establishing equal brightness easier and much more reliable. In this method, one might begin at one end of the spectrum and move through it is small increments, inching along until the other end of the spectrum is reached. This procedure was quite different from other methods that had been used, which compared monochromatic radiation from throughout the spectrum to a fixed “white” light produced by a broad spectrum source. Hyde’s conclusion made the difficulties clear: In ordinary photometric comparisons involving difference of color the older method of direct comparison is adequate if a sufficient number of observers are employed to secure a fairly average eye. The curve of relative visibility obtained by the method of direct comparison is found to be definitely different from that obtained by other investigators using the flicker method. The latter is somewhat broader and shows relatively too large values in the red end of the spectrum. Such was the state of things when, at the fifth meeting of the International Commission on Illumination held in Paris in 1921, Hyde gave a summary of most of the work that had been done on establishing a luminous efficiency function to that time. Hyde pointed out that discrepancies remained between data collected with flicker photometry and step-by-step direct comparison methods, and called for a new set of experiments to assess the differences. It became clear that if international agreement was to be obtained, a new large measurement project would need to be undertaken to produce a data set that met international standards and upon which the international community could agree and approve for global use. In 1923 this task was undertaken by K.S. Gibson and E.P.T. Tyndall at the National Bureau of Standards in Washington, D.C. Kasson Stanford Gibson (1890-1979) was educated at Cornell University and joined the US National Bureau of Standards in 1916 and worked there in photometry and colorimetry until he retired in 1955. He served as President of the Optical Society of America and was elected a fellow of the American Association for the Advancement of Science and the Illuminating Engineering Society. Edward Philip Theodore Tyndall (1893-1979) was on the physics faculty of the University of Iowa and was a frequent visiting researcher at the US National Bureau of Standards. These new, step-by-step comparison assessments were made by Gibson and Tyndall were generally agreed to be the most careful that had been made to date. Equipment operation, calibration, and data reduction, were all done with particular care. In their work they summarized data from 6 experiments that used flicker photometry and 2 that used step-by-step comparison to determine the luminous efficiency function. Agreement between the two methods was found to be satisfactory. Full details were published in the Bulletin of the National Bureau of Standards in 1923. This formed the basis for Gibson’s report at the sixth meeting of the International Commission on Illumination held in 1924 in Geneva. Their data and the procedures used to obtain it proved to satisfy the international community and Gibson’s and Tyndall’s recommendation for a standard data set to define a photopic visibility function was adopted by the CIE. The Lumen is Adopted By then the Illuminating Engineering Society in the United States had adopted a set of values very similar to those reported by Gibson, but prior to the 1924 meeting, most differences had been worked out and the various national committees agreed to adopt the Gibson-Tyndall data as a standard. At the Geneva meeting of the CIE there were 12 official actions taken; number four was the adoption of standard values for “the visibility factor”. In the publication of the CIE of that session in Geneva the following can be found: La Commission internationale de l'Éclairage recommande, pour l'usage général, les valeurs suivantes, comme valeurs provisoires pour le facteur de visibilité. Longueur d'onde (mμ) 400 10 20 30 40 450 60 70 80 90 500 10 20 Facteur de Visibilité relative(mμ) 0.0004 0012 0040 0116 023 038 060 091 139 208 323 503 710 Longueur Facteur de d'onde Visibilité relative 530 0.862 40 954 550 995 60 995 70 952 80 870 90 757 600 631 10 503 20 381 30 265 40 175 Longueur Facteur de d'onde Visibilité (mμ) relative 650 0.107 60 061 70 032 80 017 90 0082 700 0041 10 0021 20 00105 30 00052 40 00025 750 00012 60 00006 The original standard gave data in 10 nm steps. Note that the maximum value of 1.0 (usually assumed to be at λ=555 nm) is not given. Over the years, interpolated values have been provided to make practical computations less likely to depend on individual interpolation decisions. Five years after the CIE adopted the Gibson-Tyndall data as defining the standard luminous efficiency function, Leonard Troland in his 1929 book Psychophysiology, described exactly what had happened to light: Illuminating engineers have chosen to define light in terms of the photopic visibility function, because the latter characterized conditions of daylight vision . . . It is evident that light, as thus conceived, is neither a physical nor a psychical quantity. It is rather a psychophysical notion, involving c.g.s. units on the one hand, and a physical dimension, which we may designate as Ψ on the other. Light can neither be identified with brilliance nor with radiant energy. It has the properties of both, taken together. Graph of several data sets used to obtain the “relative visibility function.” This appeared in the Recueil de Travaux of the 16th meeting of the International Commission on Illumination held in Geneva in 1924. In 1951, initial difficulties with the standard v(λ) function were officially recognized: its standard short wavelength values underestimated average response. The International Commission on Illumination adopted Deane Judd’s proposed modification of values. But by that time the standard function was so deeply rooted in scientific, industrial, and instrumentational practice, that Judd’s modification was never widely used. The standard v(λ) function defined luminous efficiency for photopic vision. At the same meeting at which it adopted Judd’s modification of the photopic function, the International Commission on Illumination established a scotopic luminous efficiency function, v’(λ). The Commission based its standard function on the data and analysis provided by B. H. Crawford at Britain’s National Physical Laboratory, and that of G. Wald at Harvard University. Using v(l) and v’(l) to Define the Lumen For more than 80 years, the photopic lumen has been defined using the data of Gibson-Tyndall: 750 Photopic lumens: Φ = 683 ∑ P(λ) v(λ) Δλ , and the scotopic lumens has been defined using the 400 750 data of Crawford- Wald: Scotopic lumens: Φ′ = 1700 ∑ P(λ ) v′(λ) Δλ . The function P(λ) in 400 these equations is the spectral power distribution of the source expressed in watts/wavelength. The idea, first formalized by Nutting, is simple: take each wavelength, evaluate (multiply) the radiant power of the source at that wavelength by the appropriate value of the v(λ) or v’(λ), which gives the relative power to produce brightness of the source at that wavelength. The cumulative effect is assumed to be obtained by simply summing what all the wavelengths do. That is, we assume that they do not interact and that their cumulative power is simply additive. The resulting sum is then scaled by either 683 or 1700. So photopic and scotopic lumens are different not only because the values used to determine the relative brightness-producing power of wavelengths is different, but the overall scaling number is different. 683 arises from the custom of tying the modern value of photopic lumens back to those of early standard light sources, and ultimately to the “parliamentary candle” of 1860, used as the standard light source in England for more than half a century. The constant 1700 accounts for the much-increased sensitivity of the visual system at scotopic light levels and the desire to have v(λ) and v’(λ) assume the same value at λ=555 nm. Doubts and Changes Beginning in 1971, William Thornton, then of Westinghouse Lamp Division, began to conduct experiments that showed not only large differences in color rendering but also brightness assessments, from results that would be expected when assessed with the traditional lumen. Aside from these problems, it has long been known that important lighting applications occur with the visual system in a state of adaptation that is between photopic and scotopic: mesopic. Until very recently it has been difficult to define a visual efficiency function for this state of adaptation. These two problems not only define the limits of the standard lumen’s meaning and utility, but point the way to the next standards. We’ll consider these issues next.
