Test 4 practice multiple choice with KEY
advertisement

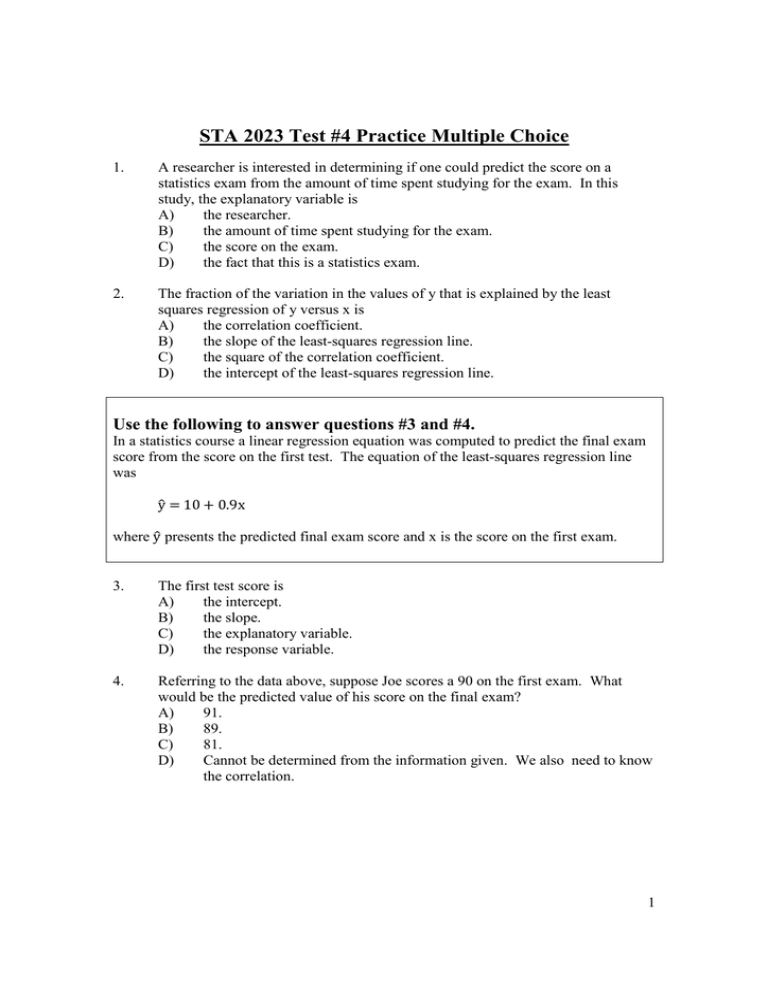
STA 2023 Test #4 Practice Multiple Choice 1. A researcher is interested in determining if one could predict the score on a statistics exam from the amount of time spent studying for the exam. In this study, the explanatory variable is A) the researcher. B) the amount of time spent studying for the exam. C) the score on the exam. D) the fact that this is a statistics exam. 2. The fraction of the variation in the values of y that is explained by the least squares regression of y versus x is A) the correlation coefficient. B) the slope of the least-squares regression line. C) the square of the correlation coefficient. D) the intercept of the least-squares regression line. Use the following to answer questions #3 and #4. In a statistics course a linear regression equation was computed to predict the final exam score from the score on the first test. The equation of the least-squares regression line was y 10 0.9x where y presents the predicted final exam score and x is the score on the first exam. 3. The first test score is A) the intercept. B) the slope. C) the explanatory variable. D) the response variable. 4. Referring to the data above, suppose Joe scores a 90 on the first exam. What would be the predicted value of his score on the final exam? A) 91. B) 89. C) 81. D) Cannot be determined from the information given. We also need to know the correlation. 1 Use the following to answer questions #5, #6, #7 and #8. A researcher wishes to determine whether the rate of water flow (in liters per second) over an experimental soil bed can be used to predict the amount of soil washed away (in kilograms). The researcher measures the amount of soil washed away for various flow rates, and from these data calculates the least-squares regression line to be amountoferodedsoil 0.4 1.3* flowrate 5. The correlation between amount of eroded soil and flow rate would be A) 1/1.3. B) 0.4. C) positive, but we cannot say what the exact value is. D) either positive or negative. It is impossible to say anything about the correlation from the information given. 6. In this study, the response variable is A) amount of eroded soil. B) flow rate. C) 0.4. D) 1.3. 7. The slope of the regression line can be interpreted in the following way: A) When the flow rate increases by one liters/sec., the erosion increases by 0.4 kilograms. B) An increase of 1.3 liters/sec in flow rate causes one kilogram of erosion. C) An erosion of 1.3 kilograms is caused by a flow rate of one liters/sec. D) An increase of one liters/sec in flow rate, causes an increase of 1.3 kilograms in erosion. 8. Which of the following is true of the least-squares regression line? A) The slope is the change in the response variable that would be predicted by a unit change in the explanatory variable. B) It always passes through the point (J, M), where J and M are the means of the explanatory and response variables, respectively. C) It will only pass through all the data points if r = ± 1. D) All of the above. 2 Use this plot to answer question #9. The following is a scatter plot of the calories and sodium content of several brands of meat hot dogs. The least-squares regression line has been drawn in on the plot. 9. Referring to the scatter plot above, based on the least-square regression line one would predict that a hot dog containing 150 calories would have a sodium content of approximately A) 600. B) 425. C) 350. D) cannot be determined from the information given. 10. Which of the following is true of the correlation coefficient r? A) It is a resistant measure of association. B) −1 ≤ r ≤ 1. C) If r is the correlation between X and Y, then -r is the correlation between Y and X. D) all of the above. 11. Suppose a straight line is fit to data having response variable y and explanatory variable x. Predicting values of y for values of x outside the spread of the observed data is called A) contingency. B) extrapolation. C) causation. D) correlation. 3 Use the following to answer questions #12 and #13. John's parents recorded his height at various ages up to 66 months. Below is a record of the results Age (months) Height (inches) 36 35 48 38 54 41 60 43 66 45 12. Which of the following is the equation of the least-squares regression line of John's height versus age? A) Height 12* Age $ 3 Height–22 B) Age C) Height 60-0.22* Age D) Height 22.3 0.34* Age 13. Referring to the data above, John's parents decide to use the least-squares regression line of John's height on age based on the data in the previous problem to predict his height at age 21 years (252 months). We conclude A) John's height, in inches, should be about half his age, in months. B) the parents will get a fairly accurate estimate of his height at age 21 years, since the data are clearly correlated. C) such a prediction could be misleading, since it involves extrapolation. D) all of the above. 14. A lurking variable is A) a variable which is not explicitly measured but which affects the response variable. B) the true cause of a response. C) any variable that produces a large residual. D) the true variable which is explained by the explanatory variable. 15. Two variables in a study are said to be confounded if A) one cannot separate their effects on a response variable. B) they are highly correlated. C) they do not have a normal distribution. D) one of them is a placebo. 4 Use the following to answer questions #16 and #17. I wish to determine the correlation between the height (in inches) and weight (in pounds) of 21-year-old males. To do this I measure the height and weight of two 21-year-old men. The measured values are Height Weight Male #1 70 160 Male #2 75 200 16. The correlation r computed from the measurements on these males is A) 1.0. B) positive and between 0.25 and 0.75. C) near 0, but could be either positive or negative. D) exactly 0. 17. Referring to the data above, the correlation r would have units in A) inches. B) pounds. C) inches-pounds. D) no units. Correlation is a unitless quantity. 18. Consider the following scatter plot. The correlation between X and Y is approximately A) 0.999. B) 0.8. C) 0.0. D) -0.7. 5 19. Consider the following scatter plot. Suppose the value of r 2 = 76% , which of the following is a plausible value for r? A) B) C) D) 0.87. -0.87. -0.9. 56% ANSWER KEY: 1. B 2. C 3. C 4. A 5. C 6. A 7. D 8. D 9. B 10. B 11. B 12. D 13. C 14. A 15. A 16. A 17. D 18. B 19. B 6


