Propagation of Laser Beam
advertisement

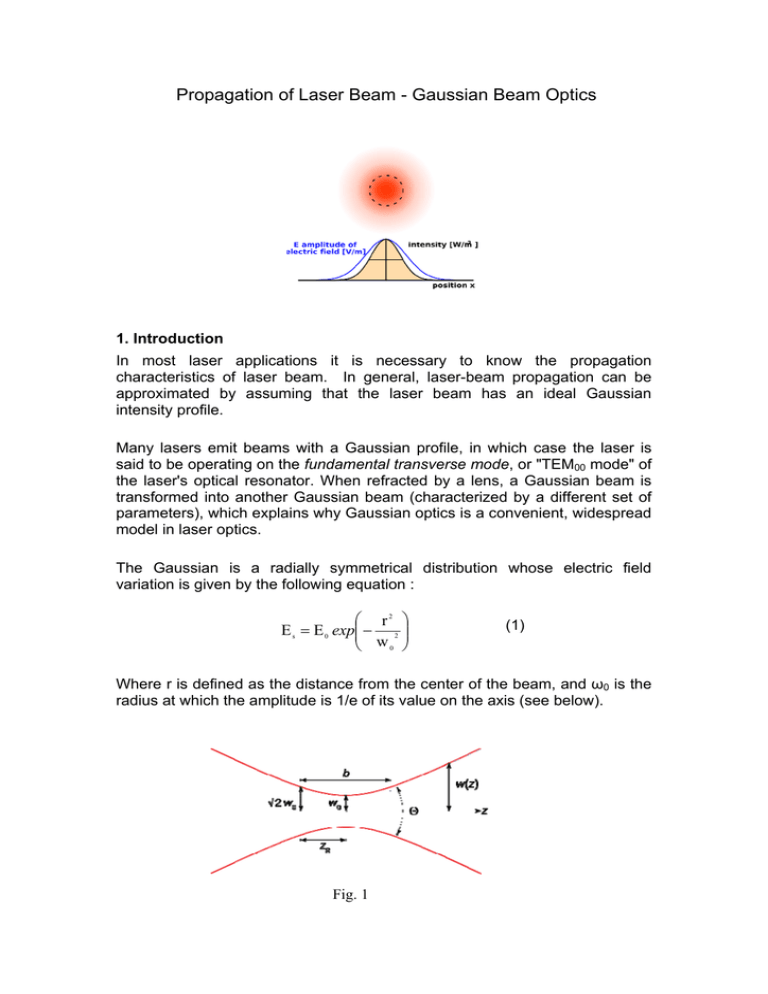
Propagation of Laser Beam - Gaussian Beam Optics 1. Introduction In most laser applications it is necessary to know the propagation characteristics of laser beam. In general, laser-beam propagation can be approximated by assuming that the laser beam has an ideal Gaussian intensity profile. Many lasers emit beams with a Gaussian profile, in which case the laser is said to be operating on the fundamental transverse mode, or "TEM00 mode" of the laser's optical resonator. When refracted by a lens, a Gaussian beam is transformed into another Gaussian beam (characterized by a different set of parameters), which explains why Gaussian optics is a convenient, widespread model in laser optics. The Gaussian is a radially symmetrical distribution whose electric field variation is given by the following equation : ⎛ r2 ⎞ E s = E 0 exp⎜⎜ − 2 ⎟⎟ ⎝ w0 ⎠ (1) Where r is defined as the distance from the center of the beam, and ω0 is the radius at which the amplitude is 1/e of its value on the axis (see below). Fig. 1 For a Gaussian beam propagating in free space, the spot size w(z) will be at a minimum value w0 at one place along the beam axis, known as the beam waist. For a beam of wavelength λ at a distance z along the beam from the beam waist, the variation of the spot size is given by ⎛ z ⎞ w( z ) = w 0 1 + ⎜⎜ ⎟⎟ ⎝ zR ⎠ 2 (2) where the origin of the z-axis is defined, without loss of generality, to coincide with the beam waist, and where is called the Rayleigh range. The Fourier Transform of Eq. (1) is also a Gaussian distribution. If we were to solve the Fresnel integral itself rather than the Fraunhofer approximation, we would find that a Gaussian source distribution remains Gaussian at every point along its path of propagation through the optical system. This makes it particularly easy to visualize the distribution of the fields at any point in the optical system. The intensity is also Gaussian: ⎛ 2r 2 I s = I 0 exp⎜⎜ − 2 ⎝ ω0 ⎞ ⎟ ⎟ ⎠ (3) Most lasers automatically oscillate with a Gaussian distribution of electrical field. The basic Gaussian may also take on some particular polynomial multipliers and still remain its own transform. These field distributions are known as higher-order transverse modes and are usually avoided by design in most practical lasers. The Gaussian has no obvious boundaries to give it a characteristic dimension like the diameter of the circular aperture. Fig. 2 The Gaussian beam radius or beam waist w0, is thus the radius at which the intensity has decreased to 1/e2 or 0.135 of its axial, or peak value. Another point to note is the radius of half maximum, or 50% intensity, which is 0.59w0. At 2w0, or twice the Gaussian radius, the intensity is 0.0003 of its peak value, usually completely negligible. Propagation of Gaussian beams through an optical system can be treated almost as simply as geometric optics. Because of the unique self-Fourier Transform characteristic of the Gaussian, we do not need an integral to describe the evolution of the intensity profile with distance. The transverse distribution intensity remains Gaussian at every point in the system; only the radius of the Gaussian beam and the radius of curvature R(z) of the wavefront change. Imagine that we somehow create a coherent light beam with a Gaussian distribution and a plane wavefront at a position z=0. The beam size and wavefront curvature will then vary with z as shown below, Fig. 3 Rayleigh range and confocal parameter At a distance from the waist equal to the Rayleigh range zR, the width w of the beam is The distance between these two points is called the confocal parameter or depth of focus of the beam: Radius of curvature R(z) is the radius of curvature of the wavefronts comprising the beam. Its value as a function of position is Beam divergence The parameter w(z) approaches a straight line for . The angle between this straight line and the central axis of the beam is called the divergence of the beam. It is given by (4) Angular Spread and M2 The total angular spread of the beam far from the waist is then given by Θ = 2θ A Gaussian laser beam that is focused to a small spot spreads out rapidly as it propagates away from that spot. To keep a laser beam very well collimated, it must have a larger diameter. This relationship between beam width and divergence is due to diffraction. Non-Gaussian beams also exhibit this effect, but a Gaussian beam is a special case where the product of width and divergence is the smallest possible. But we are not living a perfect world! A real-life laser beam is not truly Gaussian, as shown in Fig. 4, and the divergence angle is greater than the one given above. Fig. 4 Laser beam quality is quantified by the beam parameter product (BPP). For a Gaussian beam, the BPP is the product of the beam's divergence and waist size w0. The BPP of a real beam is obtained by measuring the beam's minimum diameter and far-field divergence, and taking their product. The ratio of the BPP of the real beam to that of an ideal Gaussian beam at the same wavelength is known as M² ("M squared"). The M² for a Gaussian beam is one. All real laser beams have M² values greater than one, although very high quality beams can have values very close to one. M2 = Θ / θ (5) where Θis the divergence angle of the real-life laser beam. For a perfect Gaussian beam, M2 = 1. For real-life laser beam, M2 is more than 1. Other factors In addition, there are other distortions such as astigmatism and asymmetry, as shown in Fig. 5. To make things more complicated, some lasers are designed to produce laser beams in other TEM modes, as shown in Fig. 6. Fig 5 Fig 6 2. Experimental Procedure In this experiment, you will be given a laser, a photon detector, and other essential gadgets to measure the M2 quality factor for the laser beam that is close to the TEM00 mode. You will carry out the following procedure: (a) (b) (j) (k) (l) Set up a laser and point it to a wall, which is more than 20 m away. Set up a photon detector on a digital translation stage at about 3 cm away from the laser. Use a ruler or a tape to measure distance between the laser and the detector. Connect to the detector to a digital voltage meter. Move the detector vertically to maximize the reading. Scan the detector horizontally across the laser beam and record readings from the voltage meter. Plot the readings as a function of the horizontal positions to obtain the laser beam profile. Move the detector to ~ 6 cm away from the laser, repeat steps (b) ~ (g). Move the detector to ~ 20 cm away from the laser, repeat steps (b) ~ (g). Move the detector to ~ 5 m away from the laser, repeat steps (b) ~ (g). Move the detector to ~ 10 m away from the laser, repeat steps (b)~ (g). Move the detector to ~ 20 m away from the laser, repeat steps (b)~ (g). 3. Result and Analysis (c) (d) (e) (f) (g) (h) (i) In the following analysis, you may use MS Excel software. (a) Normalize the laser beam profile and fit the laser beam profile with Eq. (3). In your fitting, use the beam waist as a free parameter; and the best fitting gives you the beam waist. Determine the Rayleigh range. (b) Plot the beam waist, obtained from the previous step, as a function of the propagation distance and compare with Eq. (2). (i) At distances close to the laser, Eq. (3) matches the readings, so the fitting to these readings gives a value of w0. Then you may use Eq. (4) to calculate θ with a known wavelength. (ii) By using the measured beam waists at distance far away from the laser, you can obtain Θ by plotting them against the distance and calculating the slope. (c) Calculate the value of M2 by using Eq. (5). TSH 2009


