The Impact of Phase Errors on Phase Shifting Masks
advertisement

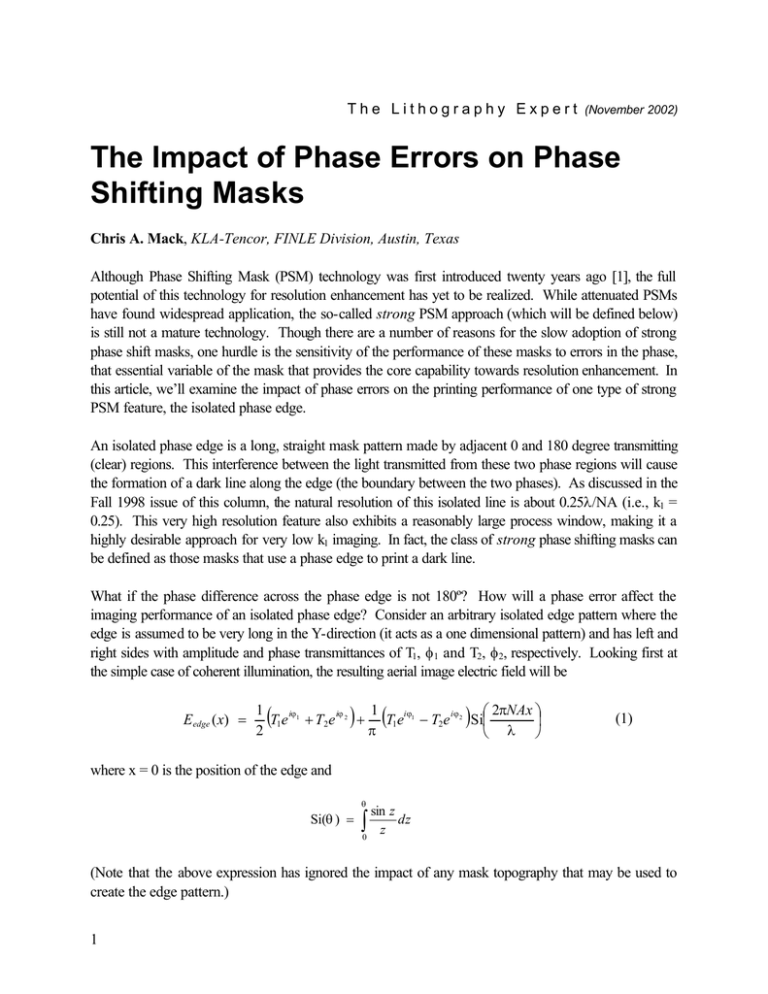
T h e L i t h o g r a p h y E x p e r t (November 2002) The Impact of Phase Errors on Phase Shifting Masks Chris A. Mack, KLA-Tencor, FINLE Division, Austin, Texas Although Phase Shifting Mask (PSM) technology was first introduced twenty years ago [1], the full potential of this technology for resolution enhancement has yet to be realized. While attenuated PSMs have found widespread application, the so-called strong PSM approach (which will be defined below) is still not a mature technology. Though there are a number of reasons for the slow adoption of strong phase shift masks, one hurdle is the sensitivity of the performance of these masks to errors in the phase, that essential variable of the mask that provides the core capability towards resolution enhancement. In this article, we’ll examine the impact of phase errors on the printing performance of one type of strong PSM feature, the isolated phase edge. An isolated phase edge is a long, straight mask pattern made by adjacent 0 and 180 degree transmitting (clear) regions. This interference between the light transmitted from these two phase regions will cause the formation of a dark line along the edge (the boundary between the two phases). As discussed in the Fall 1998 issue of this column, the natural resolution of this isolated line is about 0.25λ/NA (i.e., k1 = 0.25). This very high resolution feature also exhibits a reasonably large process window, making it a highly desirable approach for very low k1 imaging. In fact, the class of strong phase shifting masks can be defined as those masks that use a phase edge to print a dark line. What if the phase difference across the phase edge is not 180º? How will a phase error affect the imaging performance of an isolated phase edge? Consider an arbitrary isolated edge pattern where the edge is assumed to be very long in the Y-direction (it acts as a one dimensional pattern) and has left and right sides with amplitude and phase transmittances of T1, φ 1 and T2, φ 2, respectively. Looking first at the simple case of coherent illumination, the resulting aerial image electric field will be Eedge ( x) = ( ) ( ) 1 1 2πNAx iϕ iϕ iϕ iϕ T1e 1 + T2e 2 + T1e 1 − T2e 2 Si 2 π λ (1) where x = 0 is the position of the edge and θ Si(θ ) = sin z dz z 0 ∫ (Note that the above expression has ignored the impact of any mask topography that may be used to create the edge pattern.) 1 For an ideal phase edge, T1 = T2 = 1, φ 1 = 0, and φ 2 = π (180º). For a phase edge with phase error, we can let φ 2 = π + ∆φ. Using these values in equation (1) and squaring the magnitude of the electric field to obtain the intensity of the aerial image, I phase−edge ( x ) = 1 (1 − cos ∆ϕ ) + (1 + cos ∆ϕ ) 22 Si 2 2πNAx 2 π λ (2) For small phase errors (which we certainly hope will be the case), the small angle approximation to the cosine can be used, cos ∆ϕ ≈ 1 − ∆ϕ 2 2 (3) giving I phase−edge ( x ) = ∆ϕ 2 ∆ϕ 2 4 2 2πNAx + 1 − Si 4 4 π 2 λ (4) Looking closely at equation (4), it is interesting to observe that the effect of the phase error is to take the ideal image (when ∆φ = 0) and add a uniform (d.c.) flare in the amount of ∆φ 2/4. Like flare, a phase error for this feature will add a background dose, in this case caused by the incomplete cancellation of the out of phase light across the edge. To put some numerical relevance to this relationship, an 11.5º phase error is equivalent to a 1% flare level. Since flare levels of 1% or more are commonly tolerated in today’s lithographic projection tools, one would expect phase errors of 11.5º or more should be easily tolerated. While the above analysis assumes coherent illumination, simulation of partially coherent imaging of the same mask feature has shown the same relationship between phase error and flare (see Figure 1). It is well known that phase errors also cause a change in the response of a phase mask feature to focus errors. Again using simulation, the effect of phase errors on the process window of an isolated phase edge is no different than the effect of flare on the process window. However, a new effect is introduced. When the phase error is not zero, going out of focus produces a asymmetry in the image that results in an effective image placement error. Over the full range of focus within the process window, the impact on image placement error is less than +/-5nm for a 10º phase error. It seems, from the results shown here, that an isolated phase edge is relatively immune to phase errors on the order of ten degrees or so. We shall see, in the next edition of this column, whether the same can be said of a dense array of lines and spaced printed using an alternating phase shift mask. References 2 1. Marc, could you fill in your 1982 PSM paper reference here? 3 1.6 Relative Intensity 1.4 1.2 1.0 0.8 0.6 160 degrees 180 degrees 0.4 0.2 0.0 -300 -200 -100 0 100 200 300 Horizontal Position (nm) Figure 1. 4 Impact of a twenty degree phase error on the aerial image of an isolated phase edge (λ = 248nm, NA = 0.75, σ = 0.5)


