+ + = M d c ba TMIN TMAX sin or
advertisement

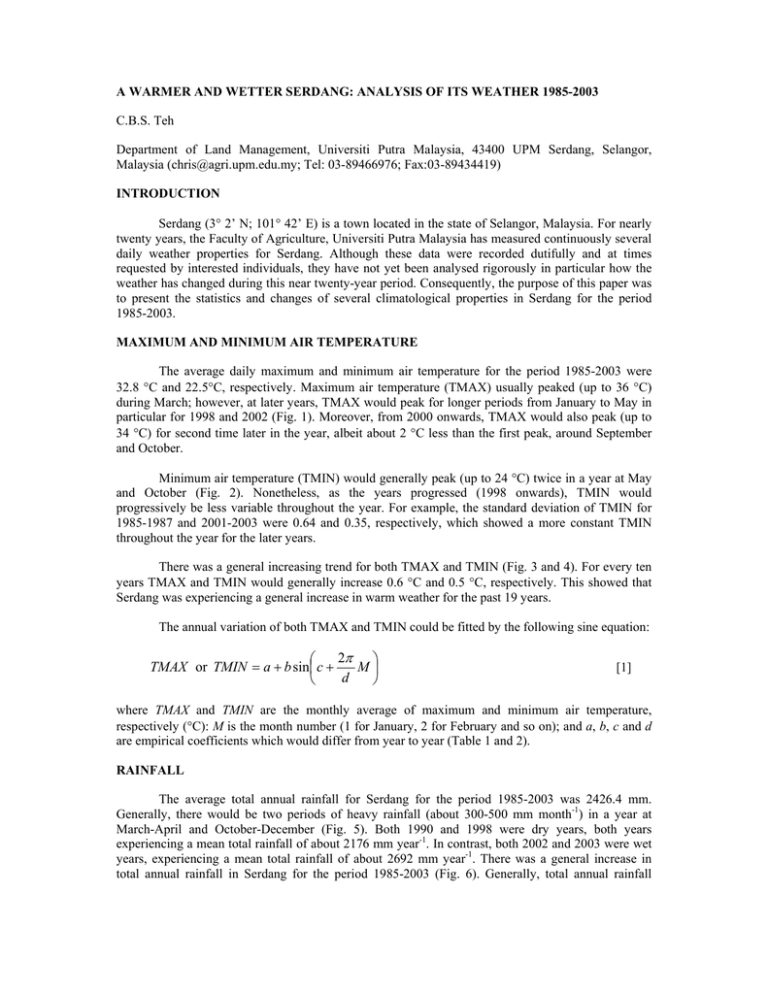
A WARMER AND WETTER SERDANG: ANALYSIS OF ITS WEATHER 1985-2003 C.B.S. Teh Department of Land Management, Universiti Putra Malaysia, 43400 UPM Serdang, Selangor, Malaysia (chris@agri.upm.edu.my; Tel: 03-89466976; Fax:03-89434419) INTRODUCTION Serdang (3° 2’ N; 101° 42’ E) is a town located in the state of Selangor, Malaysia. For nearly twenty years, the Faculty of Agriculture, Universiti Putra Malaysia has measured continuously several daily weather properties for Serdang. Although these data were recorded dutifully and at times requested by interested individuals, they have not yet been analysed rigorously in particular how the weather has changed during this near twenty-year period. Consequently, the purpose of this paper was to present the statistics and changes of several climatological properties in Serdang for the period 1985-2003. MAXIMUM AND MINIMUM AIR TEMPERATURE The average daily maximum and minimum air temperature for the period 1985-2003 were 32.8 °C and 22.5°C, respectively. Maximum air temperature (TMAX) usually peaked (up to 36 °C) during March; however, at later years, TMAX would peak for longer periods from January to May in particular for 1998 and 2002 (Fig. 1). Moreover, from 2000 onwards, TMAX would also peak (up to 34 °C) for second time later in the year, albeit about 2 °C less than the first peak, around September and October. Minimum air temperature (TMIN) would generally peak (up to 24 °C) twice in a year at May and October (Fig. 2). Nonetheless, as the years progressed (1998 onwards), TMIN would progressively be less variable throughout the year. For example, the standard deviation of TMIN for 1985-1987 and 2001-2003 were 0.64 and 0.35, respectively, which showed a more constant TMIN throughout the year for the later years. There was a general increasing trend for both TMAX and TMIN (Fig. 3 and 4). For every ten years TMAX and TMIN would generally increase 0.6 °C and 0.5 °C, respectively. This showed that Serdang was experiencing a general increase in warm weather for the past 19 years. The annual variation of both TMAX and TMIN could be fitted by the following sine equation: 2π ⎞ ⎛ TMAX or TMIN = a + b sin ⎜ c + M⎟ d ⎝ ⎠ [1] where TMAX and TMIN are the monthly average of maximum and minimum air temperature, respectively (°C): M is the month number (1 for January, 2 for February and so on); and a, b, c and d are empirical coefficients which would differ from year to year (Table 1 and 2). RAINFALL The average total annual rainfall for Serdang for the period 1985-2003 was 2426.4 mm. Generally, there would be two periods of heavy rainfall (about 300-500 mm month-1) in a year at March-April and October-December (Fig. 5). Both 1990 and 1998 were dry years, both years experiencing a mean total rainfall of about 2176 mm year-1. In contrast, both 2002 and 2003 were wet years, experiencing a mean total rainfall of about 2692 mm year-1. There was a general increase in total annual rainfall in Serdang for the period 1985-2003 (Fig. 6). Generally, total annual rainfall would increase by 26 mm every year; this indicated that Serdang was experiencing a general increase in wet weather for the past 19 years. The generic sine equation as Eq. [1] was used to fit the annual variation of rainfall: 2π ⎞ ⎛ R = a + b sin ⎜ c + M⎟ d ⎝ ⎠ [2] where R is the monthly total rainfall (mm). The other variables are the same as described for Eq. [1]. Table 3 shows that the empirical coefficients of rainfall would differ from year to year. WIND SPEED The average daily wind speed for Serdang for the period 1985-2003 was 0.8 ms-1. As the years progressed, there was a general decline in wind speed, where 1985-1987 experienced mean wind speed of about 0.9 ms-1 as compared to 0.6 ms-1 for 2001-2003 (Fig. 7). Moreover, periods of peak wind speeds (up to 1.2 ms-1) would progressively decline from 1985 to 1996, where after 1997 there was generally little annual variation in wind speeds. Fig. 8 shows that the mean annual wind speed would generally decline 0.19 ms-1 for every ten years. SUNSHINE HOURS Sunshine hours is the sum of hours in a day during which the direct solar irradiance exceeds 120 Wm-2 (Campbell and Norman, 1998). The average daily sunshine hours for Serdang for the period 1985-2003 was 5.9 hours. Typically, January to August each year would receive 6-8 hours of sunshine, in which February to April were the highest peak period, receiving up to 8 hours of sunshine (Fig. 9). Fig. 10 shows no trend of change in the annual mean sunshine hours for Serdang. PAN EVAPORATION Evaporation of free water was measured from the pan evaporation. The average pan evaporation for Serdang for the period 1985-2003 was 4.2 mm day-1. No clear trend could be identified for any change in the mean annual or monthly pan evaporation (Fig. 11 and 12). Monthly mean pan evaporation could be estimated using the following regression equation: E = −4.542 + 0.284TMAX − 0.087TMIN + 0.125S + 0.862W [3] where E is the monthly mean pan evaporation (mm day-1); W is the monthly mean wind speed (ms-1); S is the monthly mean sunshine hours (hour); and TMAX and TMIN are the variables as described previously. All coefficients in Eq. [3] were significantly different from zero at the 5% level, and Eq. [3] explained about 57% of the observed variance. As expected, Eq. [3] shows that evaporation would increase with increasing sunshine hours, wind speed and air temperature. Fig. 13 shows the degree of fit of Eq. [3] to the measured pan evaporation. CONCLUSION The weather for Serdang for the period 1985-2003 has changed in particular the mean daily maximum and minimum air temperature (increasing by 0.6 °C and 0.5 °C for every ten years, respectively), total annual rainfall (increasing by 26 mm every year), and mean daily wind speed (decreasing by 0.19 ms-1 every year). Nonetheless, no changes in mean daily sunshine hours and pan evaporation could be observed, although pan evaporation could be estimated fairly accurately using measured data of sunshine hours, maximum and minimum air temperatures, and wind speed. Daily weather data for Serdang is available upon request from the Soil Physics Laboratory, Department of Land Management, Faculty of Agriculture, Universiti Putra Malaysia. REFERENCES Campbell, G.S., Norman, J.M., 1998. An introduction to environmental biophysics. 2nd. edn. Springer-Verlag, New York. Table 1. Equation coefficients for the monthly mean maximum air temperature Coefficients Year 1985 1986 1987 1988 1989 1990 1991 1992 1993 1994 1995 1996 1997 1998 1999 2000 2001 2002 2003 a 32.17 32.09 32.43 32.20 32.37 32.82 32.58 33.06 32.37 32.52 32.89 32.50 33.15 33.67 17.67 32.67 33.21 33.91 14.47 b 0.82 0.97 0.87 0.88 0.57 0.99 0.96 0.97 0.44 0.32 0.75 1.01 0.66 1.32 15.61 0.72 0.38 1.18 19.21 c 5.94 5.24 6.08 6.49 4.91 6.12 6.49 3.76 6.54 6.90 5.86 5.83 4.77 6.31 7.52 3.73 4.36 6.40 7.51 d 15.21 15.53 13.69 14.52 10.92 12.75 17.76 5.43 14.72 16.06 12.40 14.04 9.67 13.92 94.52 6.45 8.56 13.17 109.49 Table 2. Equation coefficients for the monthly mean minimum air temperature Coefficients Year 1985 1986 1987 1988 1989 1990 1991 1992 1993 1994 1995 1996 1997 1998 1999 2000 2001 2002 2003 a 21.66 4.26 5.67 7.63 7.39 9.28 22.68 22.56 -2.36 12.52 -4.26 0.28 22.72 23.20 22.40 21.31 22.86 13.27 23.11 b -0.57 -18.31 -17.18 -14.95 -15.34 -13.63 -0.53 -0.64 -25.16 -9.90 -27.14 -22.51 -0.56 -0.52 0.37 -1.55 0.31 -9.93 0.33 c 8.90 10.51 10.57 10.68 10.54 10.51 7.44 7.53 10.65 10.65 10.68 10.65 7.62 8.06 4.32 10.10 4.02 10.48 4.99 d 12.07 99.47 101.42 112.71 93.72 92.22 9.42 9.56 134.91 131.10 142.63 131.40 9.63 10.10 8.01 99.39 7.66 96.03 9.39 Table 3. Equation coefficients for the monthly total rainfall Coefficients Year 1985 1986 1987 1988 1989 1990 1991 1992 1993 1994 1995 1996 1997 1998 1999 2000 2001 2002 2003 a 162.12 162.12 173.70 187.32 178.85 178.70 208.12 176.77 248.71 178.74 200.03 190.79 171.87 189.07 186.07 211.19 214.55 187.58 237.26 b 113.48 116.18 75.36 58.67 92.76 43.70 149.04 89.95 101.24 95.70 90.39 52.08 127.73 42.99 111.40 74.70 44.69 110.21 94.30 c 5.28 5.64 4.80 6.06 5.55 2.83 4.27 5.50 2.64 4.63 4.52 5.43 5.72 4.90 5.05 6.59 4.87 4.12 5.96 d 8.06 8.93 6.91 6.69 7.14 5.45 7.01 8.80 5.92 6.98 8.00 7.61 7.91 11.35 6.90 9.56 6.71 7.09 9.17 12 deg. C 31 32 33 34 35 36 10 Month 8 6 4 2 1986 1988 1990 1992 1994 1996 1998 2000 Year Fig. 1. Distribution of maximum air temperature for Serdang (1985-2003) 2002 12 deg. C 21.0 21.5 22.0 22.5 23.0 23.5 24.0 10 Month 8 6 4 2 1986 1988 1990 1992 1994 1996 1998 2000 Year Fig. 2. Distribution of minimum air temperature for Serdang (1985-2003) 2002 Temperature (deg. C) 34 y = 0.0623x - 91.372 R2 = 0.5604 33.5 33 32.5 32 1985 1987 1989 1991 1993 1995 1997 1999 2001 2003 Year Fig. 3. Mean annual maximum air temperature for Serdang (1985-2003) Temperature (deg. C) 24 23.5 y = 0.0491x - 75.295 R2 = 0.6251 23 22.5 22 21.5 21 1985 1987 1989 1991 1993 1995 1997 1999 2001 2003 Year Fig. 4. Mean annual minimum air temperature for Serdang (1985-2003) 12 mm/month 100 200 300 400 500 10 Month 8 6 4 2 1986 1988 1990 1992 1994 1996 Year Fig. 5. Distribution of total rainfall for Serdang (1985-2003) 1998 2000 2002 4000 y = 25.773x - 48965 Total rainfall (mm) R2 = 0.3008 3000 2000 1000 0 1985 1987 1989 1991 1993 1995 1997 1999 2001 2003 Year Fig. 6. Total annual rainfall for Serdang (1985-2003) 12 m/s 0.0 0.2 0.4 0.6 0.8 1.0 1.2 10 Month 8 6 4 2 1986 1988 1990 1992 1994 1996 Year Fig. 7. Distribution of wind speed for Serdang (1985-2003) 1998 2000 2002 1.2 Wind speed (m/s) 1 0.8 0.6 0.4 y = -0.0185x + 37.628 R2 = 0.8884 0.2 0 1985 1987 1989 1991 1993 1995 1997 1999 2001 2003 Year Fig. 8. Mean annual wind speed for Serdang (1985-2003) 12 hour 3 4 5 6 7 8 10 Month 8 6 4 2 1986 1988 1990 1992 1994 1996 Year Fig. 9. Distribution of sunshine hours for Serdang (1985-2003) 1998 2000 2002 Sunshine hours (hour) 7 6 5 4 3 y = 0.0173x - 28.658 R2 = 0.0889 2 1 0 1985 1987 1989 1991 1993 1995 1997 1999 2001 2003 Year Fig. 10. Mean annual sunshine hours for Serdang (1985-2003) 12 mm/day 1 2 3 4 5 6 7 8 10 Month 8 6 4 2 1986 1988 1990 1992 1994 1996 1998 Year Fig. 11. Distribution of pan evaporation for Serdang (1985-2003) 2000 2002 4.7 Evaporation (mm/day) 4.6 y = 0.0014x + 1.4233 R2 = 0.002 4.5 4.4 4.3 4.2 4.1 4 3.9 3.8 1985 1987 1989 1991 1993 1995 1997 1999 2001 2003 Year Fig. 12. Mean annual pan evaporation for Serdang (1985-2003) fitted (mm/day) 6 1:1 5 4 3 2 2 3 4 5 6 measured (mm/day) Fig. 13. Comparison between fitted (estimated) and measured pan evaporation


