Magnitude Bode Plot for the Low Pass Filter
advertisement
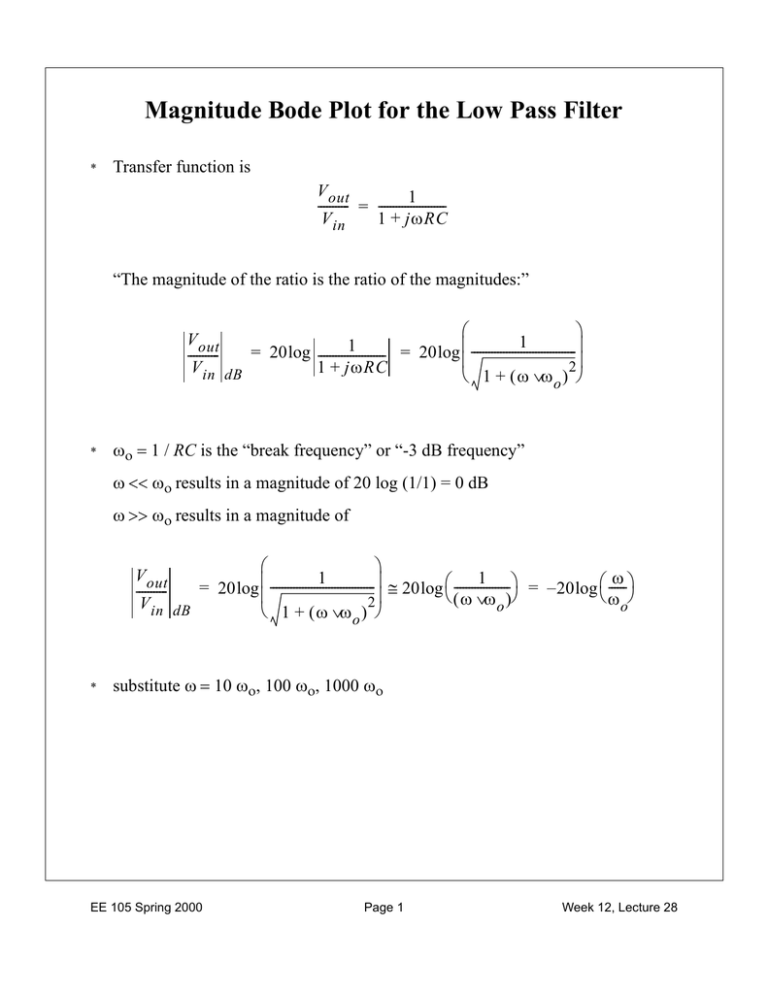
Magnitude Bode Plot for the Low Pass Filter * Transfer function is V out 1 ----------- = ----------------------V in 1 + jωRC “The magnitude of the ratio is the ratio of the magnitudes:” V out 1 1 = 20 log ----------------------- = 20 log ------------------------------------ ---------- 2 V in dB 1 + jωRC 1 + (ω ⁄ ω ) o * ωο = 1 / RC is the “break frequency” or “-3 dB frequency” ω << ωο results in a magnitude of 20 log (1/1) = 0 dB ω >> ωο results in a magnitude of V out ω 1 1 = 20 log ------------------------------------ ≅ 20 log ------------------- = – 20 log ------ ---------- ( ω ⁄ ω ) ω 2 V in dB o o 1 + (ω ⁄ ω ) o * substitute ω = 10 ωο, 100 ωο, 1000 ωο EE 105 Spring 2000 Page 1 Week 12, Lecture 28 Approximate Magnitude Bode Plot * Sketch asymtotes above and below the break frequency Vout Vin dB 0 -20 -40 -60 -80 ω ωο At ω = ωο , the exact magnitude is: V out 1 1 = 20 log ------------------------------------------- = 20 log ---------------- = – 3dB V in dB 1 + j ( ωo ⁄ ωo ) 1+1 EE 105 Spring 2000 Page 2 Week 12, Lecture 28 Phase Bode Plot for Low Pass Filter * From the definition of the phase, V out 1 ∠----------- = ∠ ----------------------- = ∠1 – ∠( 1 + j ( ω ⁄ ω o ) ) = – ∠( 1 + j ( ω ⁄ ω o ) ) 1 + jωRC V in * Substituting the arctangent, V out ∠----------- = – atan ( ω ⁄ ω o ) V in * Look at asymtotes, again: ω << ωο results in a phase of - atan(0) = 0 ω >> ωο results in a phase of - atan(infinity) = - 90o ω = (1/10)ωο results in a phase of - atan(0.1) = - 6o ω = (10)ωο results in a phase of - atan(10) = - 84o ω = ωο results in a phase of - atan(1) = - 45o Vout 0.1ωο Vin ωο 10ωο ω −45 −90 EE 105 Spring 2000 Page 3 Week 12, Lecture 28 Finding the Output Waveform from the Bode Plot * Suppose that vin(t) = 100 mV cos (ωοt + 0o) note that the input signal frequency is equal to the break frequency and that the phase is 0o ... the input signal phase is arbitrary and is generally selected to be 0. the output phasor is: 1 1 V out = V in ---------------------------------- = V in ----------1 + j( ωo ⁄ ωo ) 1+j magnitude: V out = – 3dB ----------V in dB V in 100mV ---------- = ------------------ = 71mV V out = 2 2 … phase: V out ∠----------- = ∠1 – ∠( 1 + j ) = 0 – 45° V in V out = ( 71mV )e ∠V out = – 45° – j45° output waveform vout(t) is given by: v out(t) = Re V out e jω o t = Re ( 71mVe – j45° jω o t e ) o v out(t) = 71 mVcos ( ω o t – 45 ) EE 105 Spring 2000 Page 4 Week 12, Lecture 28 Bode Plots of General Transfer Functions * Procedure is to identify standard forms in the transfer functions, apply asymptotic techniques to sketch each form, and then combine the sketches graphically Ajω ( 1 + jωτ 2 ) ( 1 + jωτ 4. )... ( 1 + jωτ n ) H ( jω ) = ----------------------------------------------------------------------------------------------( 1 + jωτ 1 ) ( 1 + jωτ 3 )... ( 1 + jωτ n – 1 ) where the τi are time constants -- (1/τi) are the break frequencies, which are called poles when in the demoninator and zeroes when in the numerator * From complex algebra, the factors can be dealt with separately in the magnitude and in the phase and the results added up to find |H(jω) | and phase (H(jω)) Three types of factors: 1. poles (binomial factors in the denominator) 2. zeroes (binomial factors in the numerator) 3. jω in the numerator (or denominator) (note: we aren’t going to consider complex poles) EE 105 Spring 2000 Page 5 Week 12, Lecture 28 Rapid Sketching of Bode Plots * Poles: - 3 dB and -45o at break frequency 0 dB below and -20 dB/decade above 0o for low frequencies and -90o for high frequencies; width of transition is between 10 and (1/10) break frequency * Zeros: +3 dB and +45o at break frequency 0 dB below and + 20 dB/decade above 0o for low frequencies and +90o for high frequencies; width of transition is between 10 and (1/10) break frequency * jω: +20 dB/decade (0 dB at ω = 1 rad/s) and +90o contribution to phase Example I: EE 105 Spring 2000 Page 6 Week 12, Lecture 28 Magnitude and Phase Bode Plot Sketches |H(jω)|dB ω EE 105 Spring 2000 Page 7 Week 12, Lecture 28 Phase Bode Plot Sketches H(jω) ω EE 105 Spring 2000 Page 8 Week 12, Lecture 28

