Chapter 9 - Worksheet Answers - AS-A2
advertisement

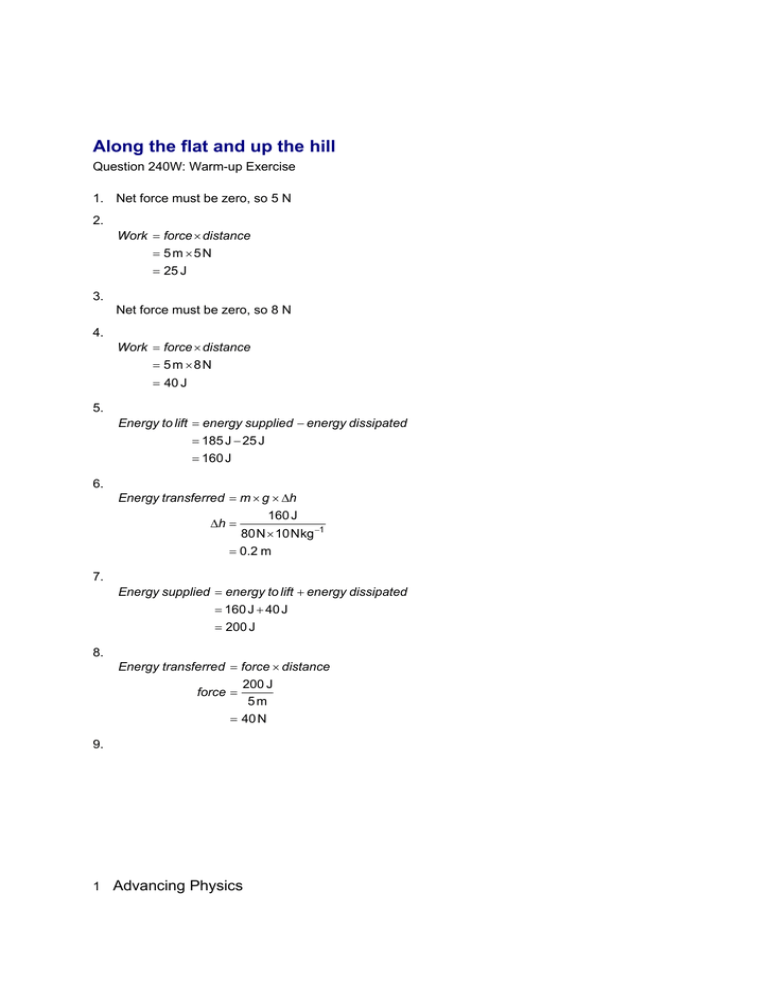
Along the flat and up the hill Question 240W: Warm-up Exercise 1. Net force must be zero, so 5 N 2. Work force distance 5m 5N 25 J 3. Net force must be zero, so 8 N 4. Work force distance 5m 8N 40 J 5. Energy to lift energy supplied energy dissipated 185 J 25 J 160 J 6. Energy transferred m g h 160 J h 80 N 10 N kg 1 0 .2 m 7. Energy supplied energy to lift energy dissipated 160 J 40 J 200 J 8. Energy transferred force distance force 200 J 5m 40 N 9. 1 Advancing Physics drag retarding force due to gravity Calculated steps Question 20S: Short Answer 1. a check point WILTSHIRE 10 km 2. 2 Advancing Physics b check point WILTSHIRE 10 km 3. 3 Advancing Physics c b a check point WILTSHIRE 10 km 4. Use A = r 2 to get: 1 hour, 50.3 km2; 2 hours, 201.1 km2; 3 hours, 452.4 km2. Yes, the area to be searched is proportional to the time2. 5. Use A = r 2 to get: 3 km hr–1, 28.3 km2; 5 km hr–1, 50.3 km2; 5 km hr–1, 78.6 km2. Yes, the area to be searched is proportional to the speed2. 6. The faster you go, the more often you need to check where you are, in order to retain the same predictive power about where you will be next. Coping with graphs Question 30S: Short Answer 1. The gradient of the speed-time graph is constant 2. gradient of graph = acceleration gradient 15 m s –1 1.5 m s – 2 10 s or 4 Advancing Physics a v u t a 15 m s –1 0 m s –1 1. 5 m s – 2 10 s 3. at 4s, speed = slope of tangent 62 6.2 m s –1 10 4. at 10s, speed 106 15.1 m s –1 7 5. average speed= 10.7 m s –1 6. average acceleration 15.1 m s –1 6.2 m s –1 1.48 m s – 2 6s 7. Answers correspond well, but difficult to draw tangents accurately. Calculating accelerated steps Question 50S: Short Answer Use the relationships v = a t, x = v t, and the approximation (average speed = (initial speed + final speed) / 2) to get these values: Time interval / s Speed at start of interval / m s–1 Acceleration during interval / m s–2 Speed at end of interval / m s–1 Average speed during interval / m s–1 Distance covered during this interval / m 0–0.5 5.00 –4.00 3.00 4.00 2.00 0.5–1.0 3.00 –3.00 1.50 2.25 1.125 1.0–1.5 1.50 –2.00 0.50 1.00 0.50 1.5–2.0 0.50 –1.00 0.00 0.25 0.125 The platform must go 3.75 m beyond the trackside bollard. 5 Advancing Physics Uniform acceleration Question 60S: Short Answer 1. v = u + a t, 60 m s–1 from zero at 4 m s–2 so t = 15 s. 2. s = ½ a t2. Substitute in this equation to get 450 m. 3. The speed of air over the wings is the key. If air is already moving over the wings (head winds) you do not need as high a forward velocity as in still air. 4. 25 20 15 10 5 0 0 2 4 6 8 10 time / s 5. Acceleration is uniform up to t = 4 s and decreases from t = 4 to t = 8 s, after which car moves with constant speed 6. As car speed increases, air resistance increases with speed, resulting accelerating force decreases, so acceleration decreases. When resistive force = driving force, resultant force = 0 and car moves with uniform speed. 7. In first 5s, distance travelled = area under curve 1 15.4 m s –1 5 s 38.5 m 2 From 5s to 9s, area of trapezium 15.4 m s –1 23 m s –1 4 s 76.8 m 2 Total distance in first 9s = 38.5 + 76.8 = 115.3m 8. Estimate acceleration = average gradient 15.0 m s –1 0 m s –1 3.0 m s – 2 5s Braking distance and the Highway Code 6 Advancing Physics Question 70S: Short Answer 1. For example, 50 km h–1 = 50 1000 m / 3600 s = 13.9 m s–1 etc. 2. For example 13.9 m s–1 t = 9.7m thus t = 0.7 s. 3. Use new reaction times and add appropriate braking distance. 30.6 m + 71.2 m = 101.8 m and 39.8 m + 71.2 m = 111 m. 4. 13.92 =193 m, use the graph to decide which surface gives a braking distance of 13 m. 5. Use v2 = u2 + 2 as. v = 0 and a is negative here so, u2 = 2 as, so plot initial speed squared against braking distance, assuming a is constant, which should give a linear graph through the origin. Throwing a ball Question 80S: Short Answer 1. time in air range 46 m 3.1s horizontal component 15 m s –1 2. 15 m s–1, same as horizontal component because angle = 45° 3. time to maximum height = half total time = 1.5 s 4. υ 2 u 2 2gs υ 0, u 15 m s –1 so g (15 m s –1 ) 2 u2 9 .8 m s – 2 2s 2 11.5 m A slide Question 90S: Short Answer 1. Right, as both cars have the same amount of kinetic energy on leaving the track. A good answer would relate this to the same drop in height, explicitly linking the change in potential energy to the change in kinetic energy. 2. Right, as the bottom arrangement gains kinetic energy more quickly, making the average speed greater. A good answer would relate this more rapid change in kinetic energy to the steepness of the slope–top arrangement gets faster sooner! 3. Same, assuming the frictional forces are really negligible as the change in kinetic energy equated to the change in potential energy soon gives: 7 Advancing Physics v 2gh which is independent of the mass. Accurate archery Question 110S: Short Answer 1. Time of flight 40 m 0.67 s 60 m s –1 Vertical drop 2 h 1 2 1 2 gt 9.81m s – 2 s 2.2 m 2 2 3 2. Aim above the target. 3. Similar calculations 2 h50 h60 1 5 9.81m s – 2 s 3.4 m 2 6 1 2 9.81m s – 2 1 s 4.9 m 2 4. Twice the trip time so four times fall, at 60 m now drops 20 m. Lifting a car Question 150S: Short Answer 1. Applying Newton's second law, where T is the force due to tension in the rope, on the car. T – mg = ma T – 1500 kg × 9.8 m s–2 = 1500 kg × 3.0 m s–2 T = 1.9 × 10⁴ N 3. T cos 15° = mg T = 1500 9.8 / (cos 15°) T = 1.5 104 N. Newton's second law Question 160S: Short Answer 8 Advancing Physics 1. a F 200 N 2 .5 m s – 2 m 80 kg 2. Slope is less than because at this angle, force down slope = weight / 2, which is greater than 200 N. 3. a 2000 N 20 m s – 2 100 kg 4. Twice 5. 3000 N 6. Four times 7. Astronauts will be brought to rest at the end of the dive which may require the application of a large force resulting in injury. 8. F = ma = 0.050 kg × 1000 ms–2 = 50 N 9. Not very large – as you can probably lift 250 N with one arm. 10. m 200 N 0.002 m s – 2 1.0 10 5 kg A skateboarder Question 220S: Short Answer 1. 320 J, from the intercept, when x = 0 then all of the energy is kinetic. 2. Yes, from intercept with y-axis, kinetic energy would be zero at about x = 2.1. 3. Look for the slope, same rate of exchange of energy, and intercept kinetic energy = 0 when x = 1.6 m. 9 Advancing Physics 300 200 100 0 0.0 0.5 1.0 1.5 x/m 4. Graph shows that you need 250 J: 1 2 mv 2 250 J v2 250 J 2 60 kg v 2 .9 m s 1. 5. Same starting and end points as the last graph, but now kinetic energy changes more rapidly with x when x is larger. 300 200 100 0 0.0 0.5 1.0 1.5 x/m 10 Advancing Physics The bow as a spring Question 250S: Short Answer 1. Assuming energy stored 1 1 Fe ke 2 2 2 W 1 82 N 0.7 m 28.7 J 2 2. 28.7 J 1 0.026 kg υ 2 2 υ 2 28.7 J 47 m s –1 0.026 kg k F 82 N 117 N m –1 x 0 .7 m 3. Rolling up and down slopes Question 260S: Short Answer 1. The lower line. 2. PE = mgh 135 J = 5 kg × 10 m s–2 × h h 135 J 50 kg 50 m s 2 2 .7 m PE = mgh 100 J = 5 kg × 10 m s–2 × h h 100 J 50 kg 50 m s 2 2m Working out with a cycle Question 280S: Short Answer 1. 11 Advancing Physics D W 2. F 1000 N cos( slope ) 1 F 1000 N 26 196 N 3. Energy transferred force distance 200 m 196 N Energy transferred 40 kJ 4. Energy transferred force distance 200 m 15 N Energy transferred 3 kJ 5. Energy transferred 3 kJ 39.2 kJ 42.2 kJ Power 75 s Power 563 W 6. The graph gives the retarding force as 45 N. 12 Advancing Physics 70 60 50 45 N 40 30 20 10 0 2 4 6 8 10 12 speed / m s–1 14 16 18 7. Since speed is constant, the driving force, provided by the component of gravity down the slope, must also be 45 N. Resolve to get: 1000 N sin 45 N 45N sin 1 1000 N 2.6 Displacement–time graphs Question 10M: Multiple Choice 1. The concept of displacement as a vector should guide you to B. This graph implies that the velocity is positive then abruptly changes to negative and constant, most of the time. The transition from positive to negative is almost instantaneous. 2 Graph D has the parabolic shapes we might expect for the way the height of a bouncing ball might vary with time, however in reality on each bounce the ball would lose some energy and so not reach the same height as on the previous bounce. Acceleration–time graphs Question 40M: Multiple Choice 13 Advancing Physics 1. The vehicle has constant velocity (approximately) between collisions so its acceleration between collisions is zero. During successive collisions its acceleration must be positive and negative to produce the change from positive to negative velocity as the vehicle changes direction. The acceleration will build up to a maximum and then decrease to zero as the buffer deforms. Hence the best graph is C. Adding forces graphically Question 120M: Multiple Choice 1. The 3 N and horizontal 4 N forces together give a resultant of (32 + 42) = 5 N in the opposite direction to the remaining 4 N force. So the net force is 1 N in the D direction. A loading problem Question 130M: Multiple Choice 1. (2502 + 6002) = 650 N Landing an aircraft Question 140M: Multiple Choice 1. F = 2 × T × (3/5) = 6T/5 F= ma: Some tricky problems! Question 180M: Multiple Choice 1. C 2. D Slowing down a bicycle Question 100E: Estimate 1. Mass of cyclist plus bike perhaps 100 kg, speed about 4 m s–1 14 Advancing Physics kinetic energy 1 2 mv 2 1 2 100 kg ( 4 m s 1 ) 2 800 J. A bouncing ball Question 200E: Estimate 1. Drop height 1 m, rebound height 0.25 m. mghrebound fraction of energy mghdrop 0.25 1 25%. Landing heavily Question 210E: Estimate 1. Height of drop 3 m. kinetic energy potential energy 1 2 mv 2 mgh v 2 2 10 N kg 1 3 m v 8 m s 1. 2. Impact hole 0.1 m deep, knees bend by 0.5m, mass of man 80 kg work done potential energy F d mgh 80 kg 10 N kg 1 3 m 0 .6 m F 4 kN . Note that this is five times the man's weight and a dangerously large force. F 3. Landing speed no change 4. Average force will be somewhat large, as the concrete does not yield. So, as work done must be the same, force is larger still. Analysing motion sensor data Question 50D: Data Handling 15 Advancing Physics 1. t = 0.05 s; frequency = 1 / t =1 / 0.05 s = 20 Hz; distance resolution is to the nearest 1 mm 2. Accelerated and then braking motion 1.6 1.4 1.2 1.0 0.8 0.6 0.4 0.2 0.0 2.0 2.5 3.0 3.5 4.0 4.5 5.0 5.5 time / s 3. The formula works out the distance two clicks ahead and subtracts the distance two clicks ago and then divides by the time interval t = 0.20 s. The velocities are negative because the trolley is getting closer to the motion sensor, i.e. its distance from the sensor is decreasing. 4. For cells C4 and C3 there are not enough cells before to read a formula value; for cells C66 and C67 there are not enough cells after to read a formula value. Since the trolley is stationary both at the start and at the end of the motion the value 0 m s–1 can be entered in all these cells because the distance is not changing around these times. 5. Around 3.2 s; the trolley travels about (1.455 – 1.055) = 0.40 m during the acceleration; acceleration = change in velocity / change in time = (–0.825 – 0) m s–1 / (3.2 – 2.3) s = –0.92 m s–2 (negative sign means towards the sensor); displacement = (0.177 – 1.455) m = –1.278 m (negative sign means towards the sensor). Accelerated and then braking motion 2.0 distance velocity 1.5 1.0 0.5 0.0 –0.5 –1.0 2.0 2.5 3.0 3.5 4.0 4.5 5.0 5.5 time / s 16 Advancing Physics Open the Excel Worksheet 6. The deceleration of the trolley is low at first and increases (greater gradient on the velocity-time graph as it approaches rest). It is not constant. 7. With smaller time intervals the trolley travels less far in the time interval. Values of the velocity now have larger random fluctuations. This shows up in the velocity time graph which is ‘noisier’ and less smooth than with the larger time interval. Uncertainties in measuring g Question 100D: Data Handling 1. Interval = 1 / 50 s = 0.020 s 2. spread in total distance dropped after 0.3 s 4 3 2 1 0 36 37 38 39 30 distance / cm 41 42 At t = 0.30 s the mean distance dropped = 39.7 2.0 cm (or 5%) ignoring one low outlier value at 36.3 cm. 3. d mean 0.0 0.2 0.4 1.2 17 Advancing Physics d mean 2.3 3.8 5.6 7.8 10.8 14.1 17.4 21.3 25.8 29.9 34.5 39.7 g by tickertape 45 40 35 30 25 20 15 10 5 0 0.0 0.1 0.2 time / s 0.3 0.4 y = 518 × 2.1 or distance = constant time2.1 4. For constant acceleration we know that s = ut + ½at 2 but here u = 0 so we expect a relationship of the form s = ½at 2 for a mass accelerating from rest. 5. time2 / s2 0.0000 18 Advancing Physics g linear graph 45 40 35 30 25 20 15 10 5 0 0.00 0.02 0.04 0.06 time2 / s2 0.08 0.10 y = 447x – 0.4 Using s = ½gt 2 gives an estimate for g of: (12 m s -1 )2 (8 m s -1 )2 208 m 2 s -2 14.0 m s -1 6. This value is systematically low by at least 4%, because the fall is not entirely free because of drag from the tickertape and printer. 7. t 2= 0.4 / 447 = 0.000895 s2 ; this corresponds to a time t 0.000895 0.030 s This confirms that there may have been some difficulty determining when the mass had ‘started’ to drop, by about one and a half ticks (1.5 0.02 s = 0.03 s) on average. Open the Excel Worksheet Variation in braking distance with road conditions Question 110D: Data Handling 1. Open the Excel Worksheet 2. Dry, unladen: mean braking distance = 45.1 m range = 1.4 m spread = ± 0.7 m = ± 2% rounded up. 19 Advancing Physics Dry, laden: mean braking distance = 46.4 m range = 1.3 m spread = ± 0.6 m = ± 2% rounded up. Wet, unladen: mean braking distance = 58.0 m range = 7.2 m spread = ± 3.6 m = ± 6% rounded. Wet, laden: mean braking distance = 52.1 m range = 8.5 m spread = ± 4.3 m = ± 8% rounded. 3. In wet conditions the variability of braking distance is much larger than in dry conditions. In dry conditions, braking distance is slightly greater for laden than unladen. In wet conditions, braking distance is larger for unladen than laden. 4. Dry, unladen: mean deceleration = 8.6 m s–2 Dry, laden: mean deceleration = 8.3 m s–2 Wet, unladen: mean deceleration = 6.7 m s–2 Wet, laden: mean deceleration = 7.4 m s–2 The deceleration for dry conditions is close to the acceleration due to gravity. The deceleration for wet conditions is around 20% less. 5. The % spread in deceleration is the same as the % spread in braking distance s, because deceleration only depends upon s-1 (not on any higher or lower power). Dry, unladen: spread = ± 2% rounded up Dry, laden: spread = ± 2% rounded up Wet, unladen: spread = ± 6% rounded up Wet, laden: spread = ± 8% rounded up Variation in braking distance between cars Question 120D: Data Handling 1. 20 Advancing Physics Open the Excel Worksheet 2. From 90 km h–1 mean braking distance = 41 m range = 22 m spread = ± 11 m = ± 27 From 120 km h–1: mean braking distance = 73 m range = 36 m spread = ± 18 m = ± 25% 3. Open the Excel Worksheet The decelerations average about 7.7 m s–2, and so are nearly 80% of the acceleration due to gravity. 4. The ratio of the braking distances for the two speeds is very nearly constant (about 1.8). This indicates that the deceleration is similar in the two cases, for a given car. This suggests a constant braking force, with braking distance proportional to the initial kinetic energy. Cycling through air Question 190D: Data Handling Force against average speed 20 ++ 15 + 10 + + 5 ++ + ++ 0 0 21 1 2 3 4 average speed / m s–1 Advancing Physics 5 6 power against average speed 120 ++ 100 80 60 + 40 + + 20 ++ + 0 0 1 ++ 2 3 4 average speed / m s–1 5 6 A good answer would include reference to the likely sources of retarding forces, and the likely predominance of terms due to sliding friction, rather than drag, at the low velocities. Deploying the equation relating P, F and v is likely to help to relate these to the power outputs required to go at different speeds. Retarding a cyclist Question 270D: Data Handling 1. Use power = force velocity, to calculate required power outputs, then plot power/speed and use the (given) power output of the cyclist to find his speed. 22 Advancing Physics 1200 1000 800 600 400 200 12.5 m s–1 0 2 4 6 8 10 12 speed / m s–1 14 16 18 2. First calculate the power required to lift him 2 m s–1 (vertically remember), then subtract this from his power output, to give the power available to push him through the air. power required to lift force velocity 800 N 2 m s 1 160 W power to push through air 375 W – 120 W Then use the graph again: 23 Advancing Physics 1200 1000 800 600 400 200 10.25 m s–1 0 2 4 6 8 10 12 speed / m s–1 14 16 18 3. drag weight Use the graph to get a retarding force of 28 N, for a speed of 12 m s–1. 24 Advancing Physics 70 60 50 40 30 28 N 20 10 0 2 4. 4 6 8 10 12 speed / m s–1 14 16 18 Since speed is constant, the driving force, provided by the component of gravity down the slope, must also be 28 N. Resolve to get: 800 N sin 28 N 28N sin 1 800 N 2 Inertia reel seat belts Question 170X: Explanation–Exposition 1. A good answer would relate the changes in the car's motion to the changes in the occupants' motion, arguing that a seat belt allows the occupants to share an appropriate part of the car's motion, and not the motion of the bumper. 2. A good answer would focus on the role of the gripper, that which allows the belt to run free or not. The explanation would probably connect a certain freedom of movement relative to the reel containing the spare belt to the inertial properties of the gripper, thus showing how it grips when accelerating, but not when at constant velocity. 25 Advancing Physics


