SVKM’s NMIMS UNIVERSITY SCHOOL OF DISTANCE LEARNING COURSE: ADSCM/ADITM/ADBFM/PGDFM/PGDHRM/PGDMM
advertisement
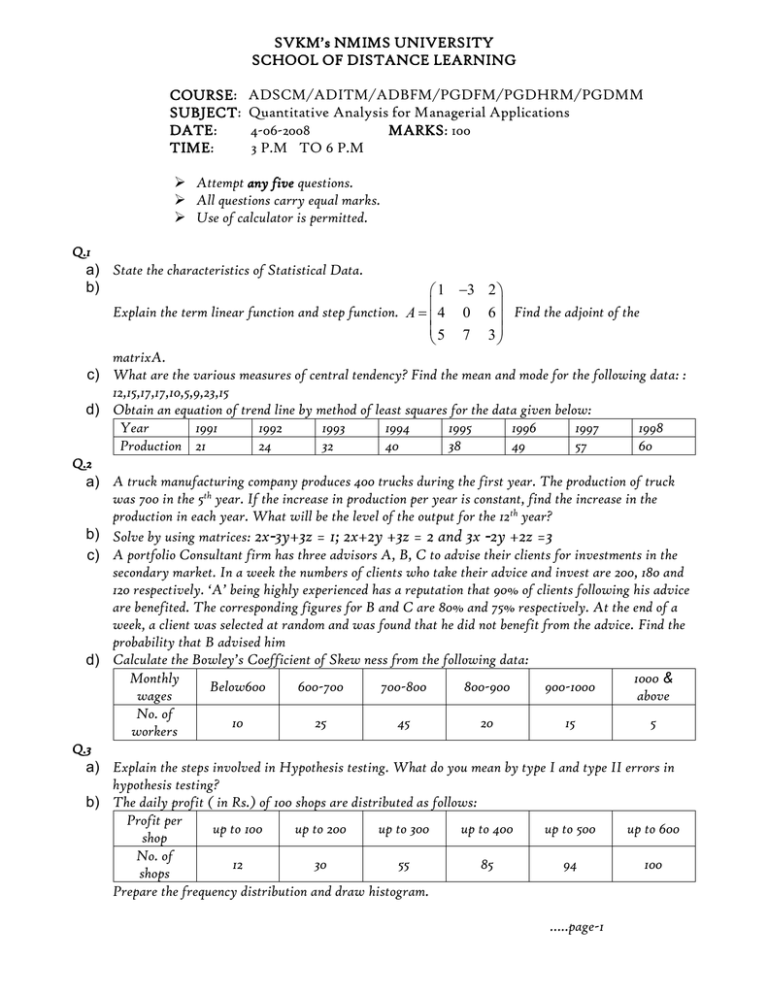
SVKM’s NMIMS UNIVERSITY SCHOOL OF DISTANCE LEARNING COURSE: SUBJECT: DATE: TIME: ADSCM/ADITM/ADBFM/PGDFM/PGDHRM/PGDMM Quantitative Analysis for Managerial Applications 4-06-2008 MARKS: 100 3 P.M TO 6 P.M Attempt any five questions. All questions carry equal marks. Use of calculator is permitted. Q.1 a) State the characteristics of Statistical Data. b) 1 3 2 Explain the term linear function and step function. A 4 0 6 Find the adjoint of the 5 7 3 matrixA. c) What are the various measures of central tendency? Find the mean and mode for the following data: : 12,15,17,17,10,5,9,23,15 d) Obtain an equation of trend line by method of least squares for the data given below: Year 1991 1992 1993 1994 1995 1996 1997 1998 Production 21 24 32 40 38 49 57 60 Q.2 a) A truck manufacturing company produces 400 trucks during the first year. The production of truck was 700 in the 5th year. If the increase in production per year is constant, find the increase in the production in each year. What will be the level of the output for the 12th year? b) Solve by using matrices: 2x-3y+3z = 1; 2x+2y +3z = 2 and 3x -2y +2z =3 c) A portfolio Consultant firm has three advisors A, B, C to advise their clients for investments in the secondary market. In a week the numbers of clients who take their advice and invest are 200, 180 and 120 respectively. ‘A’ being highly experienced has a reputation that 90% of clients following his advice are benefited. The corresponding figures for B and C are 80% and 75% respectively. At the end of a week, a client was selected at random and was found that he did not benefit from the advice. Find the probability that B advised him d) Calculate the Bowley’s Coefficient of Skew ness from the following data: Monthly 1000 & Below600 600-700 700-800 800-900 900-1000 wages above No. of 10 25 45 20 15 5 workers Q.3 a) Explain the steps involved in Hypothesis testing. What do you mean by type I and type II errors in hypothesis testing? b) The daily profit ( in Rs.) of 100 shops are distributed as follows: Profit per up to 100 up to 200 up to 300 up to 400 up to 500 up to 600 shop No. of 12 30 55 85 94 100 shops Prepare the frequency distribution and draw histogram. …..page-1 c) State the merits and limitations of Rank correlation coefficient. Find the same for the data given below: Marks in 12 18 32 18 25 24 25 40 38 22 Maths Marks in 16 15 28 16 24 22 28 36 34 19 Stats. d) In a certain lottery, one prize of Rs. 1000/- 3 prizes of Rs.500/- each, 5 prizes of Rs.100/- each and 10 prizes of Rs.50/- each are to be awarded to 19 tickets drawn from the total number of 10000 tickets sold at a prize of Re.1/- ticket. Find the expected net gain, to a person buying a particular ticket. X 1000 500 100 50 P(X) 1/10000 3/10000 5/100000 10/10000 Q.4 a) Compute mean and standard deviation for the following data. Class 0-30 30-60 60-90 90-120 120-150 150-180 Freq. 8 15 17 20 11 9 b) A firm has revenue function given by R =8x where x is the output. The production cost is C = 150000 + 60(x/900) 2 . Find the total profit function and the number of units to be sold to get the maximum profit. c) State the properties of probability density function of a continuous variable. Suppose the probability density function of different weights of a “1Kg tea pack” of a company is given by: f(x) = 100( x- 1) for -1≤ x ≤ 1.1 = 0 otherwise. Verify if it is a valid probability density function. 2 d) x 9 1 1 x 3 3 Evaluate: lim and lim 2 x 1 x x 2 x 3 x 1 Q.5 a) f(x) = 2x2 – 5x +4 , for what value of x if 2 f(x) = f(2x) b) Future technologies ltd manufactures high resolution telescopes. The management wants its products to have variation of less than two standard deviation in resolution, while focusing on objects which are beyond 500 light years. When they tested their newly manufactured telescope for 30 times, to focus on an object 500 light years away, they found that the sample standard deviation to be 1.46. State the hypothesis and test it at 1% level of significance. Can the management accept to sell this product? c) Write a note on time series analysis. d) Write a note on forecasting for medium and short term decisions. Q.6 a) Write a note on forecast control. b) Compute the Karl Pearson’s coefficient of correlation:for the following data: X 5 10 5 11 12 4 3 2 7 1 Y 1 6 2 8 5 1 4 6 5 2 c) The probability that A can solve a problem in mathematics is 4/5, that B can solve is 2/3 and that C can solve is 3/7. If all of them try independently, find the probability that the problem will be solved. d) Compare mean, median and mode. …..page-2 Q.7 a) Determine the nature of the roots: i) x2 +3x +9/4 = 0, ii) 8x2 – 19x +8= 0 b) In a certain factory turning out optical lenses there is small chance of 1/500 for any lens to be defective. The lenses are supplied in packets of 10. Use Poisson distribution to calculate the approximate number of packets containing a) no defective, b)1 defective, c) 2 defective lenses in a consignment of 20000 packets c) Plot a histogram and a frequency polygon from the following data: Marks 0-20 20-40 40-60 60-80 80-100 No. of Students 8 12 15 12 3 d) Explain the binomial distribution. The incidence of a certain disease is such that on an average 30% of workers suffer from it. If 10 workers are selected at random, find the probability that exactly two workers suffer from the disease. Q.8 a) b) c) d) What is normal distribution? State its characteristics? Solve by Cramer’s Rule: 2x-3y +z = 7; 2x+y-z =1 and 4y +3z = -11 Write a note on sampling. The regression equation of Y on X is given by 8x – 10y +66 =0 and that of X on Y is 40x – 18y =214. Find the two regression coefficients and the coefficient of correlation. Q.9 a) A quality control engineer at Zen Automobiles wants to check the variability in the number of defects in the cars coming from two assembly lines A and B . When he collected the data it was as shown below : Assembly line A Assembly Line B Mean 10 11 Variance 9 25 Sample size 20 16 Can he conclude that the assembly line B has more variability than line A? 1 0 3 2 2x y and y = Find x and y. 3 2 1 4 c) Plot the less than and more than Ogives for the data given below: Income(Rs.) 10-20 20-30 30-40 40-50 50-60 No. of 90 340 400 240 140 families d) Write a note on various non-probability sampling methods. b) 60-70 70-80 40 30 …..page-3 Q.10 a) From the prices of shares of X and Y given below, state which share is more stable in value. X 55 54 52 53 56 58 52 50 51 Y 108 107 105 105 106 107 104 103 104 49 101 b) A tyre company wants to test the stress of tyres. The tyres should withstand a minimum load of 80000Kgs, but excess load would burst the tyres. From the past experience, it is known that the standard deviation of the load is 4000Kgs. A sample of 100 tyres was selected and tests were carried on them. The result showed that the mean stress capacity of the sample is 79600Kgs. If the supplier uses a level of significance of 0.05 in testing, do the tyres meet stress requirements? c) Deseasonalize the data Production (in tonnes) Year Quarter I Quarter II Quarter III Quarter IV 1983 5 1 10 17 1984 7 1 10 16 1985 9 3 8 18 1986 5 2 15 19 d) Darjeeling Tea has developed a new blend of tea, Good Health having a superior taste and aroma than the existing brands. It wants to test market the new product before launching it nation wide. It chooses four cities and launches the product in these cities. After a month of launch, they surveyed the individuals in these cities to find whether they liked this brand or not. The result of the survey is as follows: Delhi Mumbai Kolkata Chennai Total No. of people 71 75 58 79 283 who liked Good Health No. of people 29 45 32 31 137 who didn’t like Good Health Total 100 120 90 110 420 The manager of Darjeeling Tea wants to know whether the proportion of people who like the new brand of tea, Good Health is same in all the four cities at a significance level of 10%? He uses X 2 distribution , what is his conclusion? --------------------------……….page-4
