Preview C/C vs.
advertisement
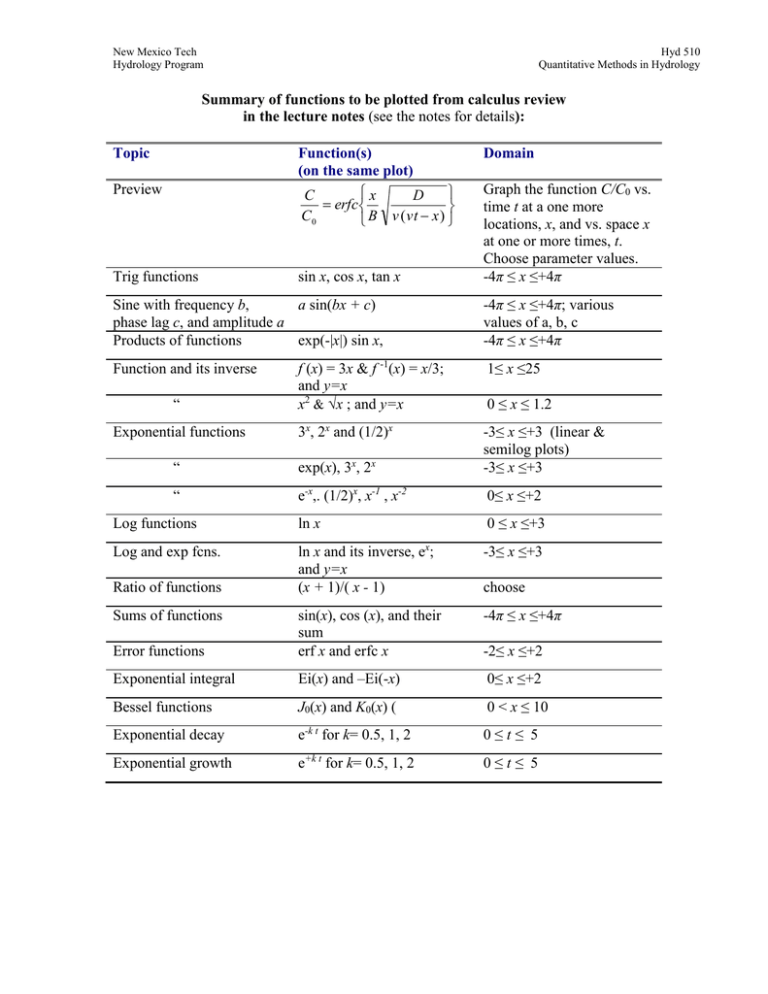
New Mexico Tech Hydrology Program Hyd 510 Quantitative Methods in Hydrology Summary of functions to be plotted from calculus review in the lecture notes (see the notes for details): Topic Function(s) (on the same plot) Domain Preview x C D erfc C0 B v ( vt x ) Trig functions sin x, cos x, tan x Graph the function C/C0 vs. time t at a one more locations, x, and vs. space x at one or more times, t. Choose parameter values. -4π ≤ x ≤+4π Sine with frequency b, a sin(bx + c) phase lag c, and amplitude a Products of functions exp(-|x|) sin x, Function and its inverse “ -4π ≤ x ≤+4π; various values of a, b, c -4π ≤ x ≤+4π f (x) = 3x & f -1(x) = x/3; and y=x x2 & √x ; and y=x 1≤ x ≤25 3x, 2x and (1/2)x 0 ≤ x ≤ 1.2 “ exp(x), 3x, 2x -3≤ x ≤+3 (linear & semilog plots) -3≤ x ≤+3 “ e-x,. (1/2)x, x-1 , x-2 0≤ x ≤+2 Log functions ln x 0 ≤ x ≤+3 Log and exp fcns. ln x and its inverse, ex; and y=x (x + 1)/( x - 1) -3≤ x ≤+3 -4π ≤ x ≤+4π Error functions sin(x), cos (x), and their sum erf x and erfc x Exponential integral Ei(x) and –Ei(-x) 0≤ x ≤+2 Bessel functions J0(x) and K0(x) ( 0 < x ≤ 10 Exponential decay e-k t for k= 0.5, 1, 2 0≤t≤ 5 Exponential growth e+k t for k= 0.5, 1, 2 0≤t≤ 5 Exponential functions Ratio of functions Sums of functions choose -2≤ x ≤+2
