Best Fit Lines and Curves Homework
advertisement
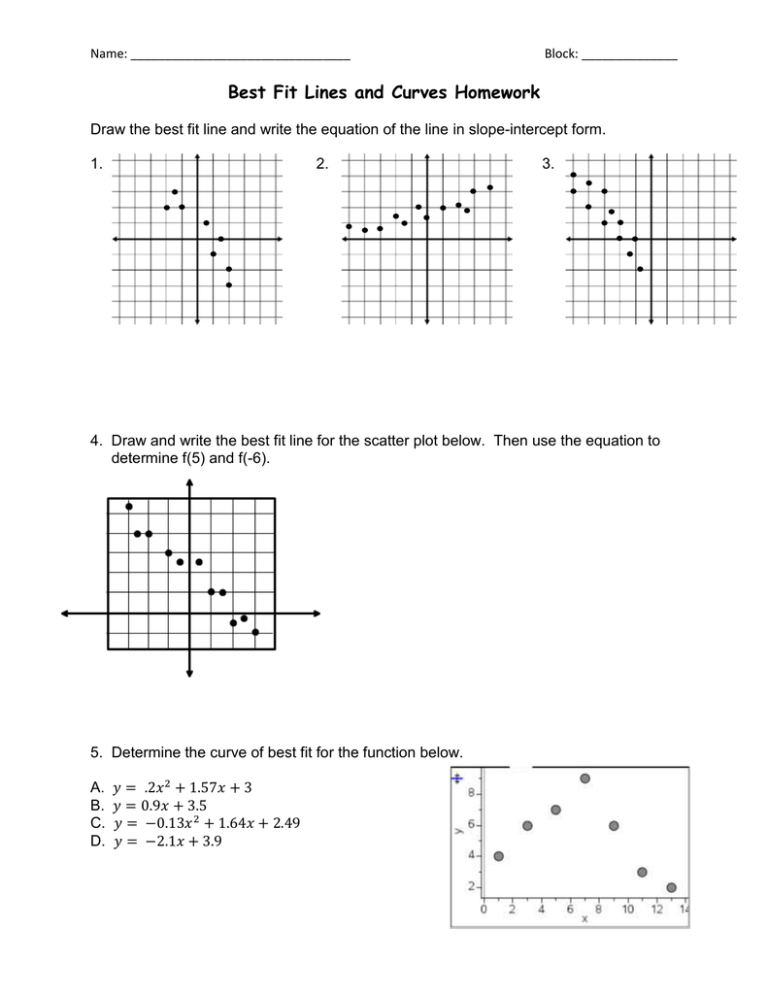
Name: ________________________________ Block: ______________ Best Fit Lines and Curves Homework Draw the best fit line and write the equation of the line in slope-intercept form. 1. 2. 3. 4. Draw and write the best fit line for the scatter plot below. Then use the equation to determine f(5) and f(-6). 5. Determine the curve of best fit for the function below. A. B. C. D. 𝑦 = .2𝑥 2 + 1.57𝑥 + 3 𝑦 = 0.9𝑥 + 3.5 𝑦 = −0.13𝑥 2 + 1.64𝑥 + 2.49 𝑦 = −2.1𝑥 + 3.9 Name: ________________________________ Block: ______________ Directions: Determine the equation of the curve of best fit for each LINEAR MODEL below. Round to the nearest 100th if necessary. 6. x y 0 2 2 7 4 14 6 17 7. 7 20 x y 1 3 0.4 1.4 5 1.9 7 2.3 9 3.2 8. Your summer camp wants to buy a sailboat. The table shows the lengths and costs of sailboats. Length (ft) Cost (dollars) 11 12 14 14 16 22 23 600 500 1900 1700 3500 6500 6000 a. Find the equation that models the data. b. Using the equation, approximate the cost of a sailboat that is 20 feet long. c. Using the equation, approximate the length of a sailboat that costs $8,000. Directions: Determine the equation of the curve of best fit for each QUADRATIC MODEL below. Round to the nearest 100th if necessary. 9. x y 0 -7 1 0 2 10 3 25 4 53 10. 5 74 x y 6 68 7.5 9 10.5 12 13.5 137 242 389 586 838 11. In September 2001, the first U.S. digital satellite radio station was launched. The table shows the number of subscribers of the service for various months after its launch. Months after launch Subscribers 0 500 3 6 9 12 15 31,000 76,000 135,500 201,500 360,000 a. Find the equation that models the data. b. Using the equation, approximate the number of subscribers 18 months after the launch. c. After how many months will there be approximately 108,000 subscribers? A. 3 B. 8 C. 10 D. 20
