Lines and Curves of Best Fit Practice Positive, Negative, or Neither
advertisement
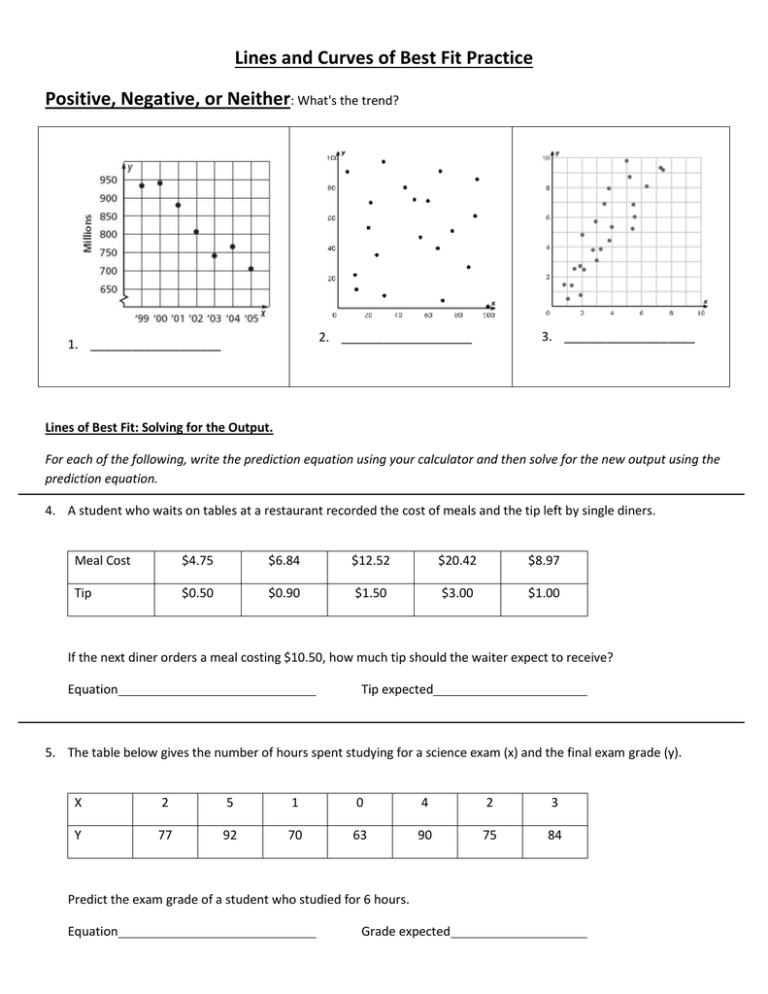
Lines and Curves of Best Fit Practice Positive, Negative, or Neither: What's the trend? 3. ___________________ 2. ___________________ 1. ___________________ Lines of Best Fit: Solving for the Output. For each of the following, write the prediction equation using your calculator and then solve for the new output using the prediction equation. 4. A student who waits on tables at a restaurant recorded the cost of meals and the tip left by single diners. Meal Cost $4.75 $6.84 $12.52 $20.42 $8.97 Tip $0.50 $0.90 $1.50 $3.00 $1.00 If the next diner orders a meal costing $10.50, how much tip should the waiter expect to receive? Equation Tip expected 5. The table below gives the number of hours spent studying for a science exam (x) and the final exam grade (y). X 2 5 1 0 4 2 3 Y 77 92 70 63 90 75 84 Predict the exam grade of a student who studied for 6 hours. Equation Grade expected Lines of Best Fit: Solving for the Input. For each of the following, write the prediction equation using your calculator and then solve for the new input using the prediction equation. 6. The table below shows the lengths and corresponding ideal weights of sand sharks. Length(in) 60 62 64 66 68 70 72 Weight (lbs) 105 114 124 131 139 149 158 Predict the length of a sand shark whose weight is 99 lbs. Equation Length expected 7. The table below gives the height and shoe sizes of six randomly selected men. Height (in) 67 70 73.5 75 78 66 Shoe size 8.5 9.5 11 12 13 8 If a man has a shoe size of 10.5, what would be his predicted height? Equation 8. Height expected Curves of Best Fit: 9. A shot-putter throws a ball at an inclination of 45° to the horizontal. The following table represents approximate heights for a ball thrown by a shot-putter as it travels a distance of x meters horizontally. A)What is the equation of the quadratic curve of best fit?_______________________ B)What would the height of the shot-put be when it was a distance of 52 meters from the thrower? _____ 10. The table below lists the total estimated numbers of AIDS cases, by year of diagnosis from 1999 to 2003 in the United States (Source: US Dept. of Health and Human Services, Centers for Disease Control and Prevention, HIV/AIDS Surveillance, 2003.) A)What is the equation of the quadratic curve of best fit?_______________________ B)How many AIDS cases do you estimate for the year 2016 based on this data? ______________ 11. Mixed Problems: These will not specify if you are looking for a line of best fit (linear regression) or a curve of best fit (quadratic regression). 12. Mr. Physic's class is launching rockets and measuring how high the rockets fly and how far away from the launch site that they land. The table shows their data. Height (m) 5 14 12 17 21 27 Distance (m) 9 26 21 40 48 60 Linear or Quadratic?___________ Equation of best fit: y =___________________ 11 19 9 18.5 23 51 Extension (Use the equation): a) How far would you expect a rocket to fly if the rocket got to a height of 80 meters? _______________ b) How high would a rocket have to fly to go a distance of 100 meters? __________________ 13. Mrs. Physic's class is launching a rocket as well. They are tracking the flight of the rocket through the air and recording exactly how high a rocket is in the air at specific times. The table shows their collected data. Time (s) 1 3 5 7 9 11 Height (ft) 5 38 53 71 89 72 Linear or Quadratic? _____________ Equation of best fit: y= ___________________ 13 50 15 32 17 3 Extension (Use the equation): a) Based on your equation, would the rocket be higher in the air at 6 seconds or 12 seconds? _________________ 14. 15.
