Line of Best Fit Practice
advertisement

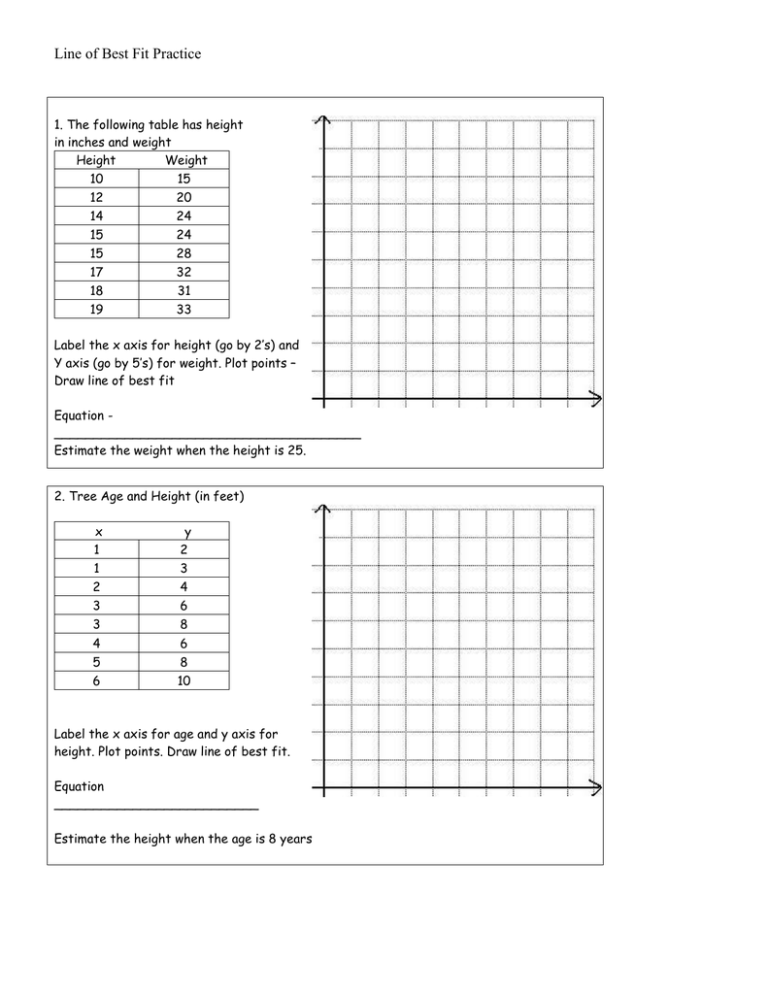
Line of Best Fit Practice 1. The following table has height in inches and weight Height Weight 10 15 12 20 14 24 15 24 15 17 18 19 28 32 31 33 Label the x axis for height (go by 2’s) and Y axis (go by 5’s) for weight. Plot points – Draw line of best fit Equation _______________________________________ Estimate the weight when the height is 25. 2. Tree Age and Height (in feet) x 1 1 2 3 3 y 2 3 4 6 8 4 5 6 6 8 10 Label the x axis for age and y axis for height. Plot points. Draw line of best fit. Equation __________________________ Estimate the height when the age is 8 years 3. Time and distance walked x y 0 0 1 2 2 3 2.5 4 3 6 3 5 7 5 7 9 Plot points – Draw line of best fit. Equation ______________________ Estimate the time when the distance is 15 4. Miles Driven – Gas in Tank Miles 0 Gallons 15 20 35 40 45 55 70 13 12 11 10 8 6 80 3 Plot points (x axis miles driven – go by 10), y axis gallons (go by 3). Draw line of best fit. Equation _____________________ After how many miles will you run out of gas? 5. Money in checking account Day 0 1 3 4 5 7 8 9 Money 300 280 260 200 170 150 120 100 Plot points (x axis days – y axis Money in bank account (go by 50)). Draw line of best fit. Equation ____________________________ After how many days will you run out of money? 6. Years of College and Income (in thousands) Years 0 1 3 5 6 7 8 10 Income 20 24 30 40 60 80 90 95 Plot points – x axis years and y axis income (go by 10’s). Draw line of best fit. Equation _________________________ About how much will you make after you have worked for 15 years?


